Share Buybacks Underpin US Stocks In August

This month was the best August for the NASDAQ index since the Dotcom bubble 18 years ago.

Both the SP 500 and the DOW Jones 30 indexes posted their best August performances since 2014.

More specifically,  Apple shares gained 20% and Amazon shares rose 12.5% during August. Together, these two names accounted for 25% of the entire NASDAQ gain last month.

It’s worth noting that share buyback programs for US listed stocks have increased over the last three years and are on track to reach $800 billion this year.

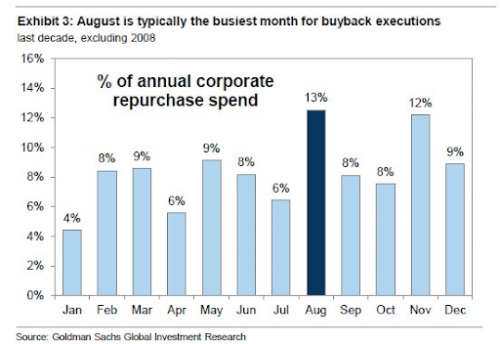
As illustrated in the chart below, August is usually the busiest month of the year for repurchasing stock and the pace drops off during September and October.

With US stocks at record highs and the local ASX index near a 10-year high, we urge investors to approach the market with caution at the current valuations.

Using our ALGO engine, we employ technical indicators to identify stock specific opportunities across a broad market spectrum during all market conditions .

Give us a call on 1-300-614-002 to discuss our current model portfolio holdings.


FOMC Overview

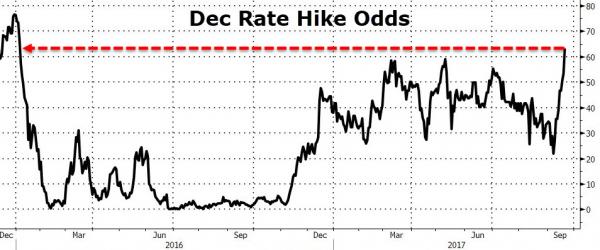
As expected, the US FOMC voted to keep rates unchanged last night but signalled that it still expects one more rate hike before the end of the year.

If that’s the case, then the FED Funds target will have been lifted from .25% to 1.50% in just over 12 months. The “Dot plots” were revised slightly lower from 3.0% to 2.75% by the end of 2019.

The response from US stock indexes was muted, but we expect the combination of higher borrowing costs and the reduction of the FED balance sheet to temper any significant gains in US equities into the end of the year.


XJO Index Watch – Key Levels you Should be Tracking

Following last night’s decision in the US to leave rates unchanged, yield stocks will begin their recovery as we forecasted. See our list of stocks and entry levels from the post dated the 2nd September for further details on specific holdings.

Our base case is for the market to remain stable and quality oversold names will revert back to higher price levels . In addition, our strategy includes earning income from companies with limited but stable earnings growth using covered calls.

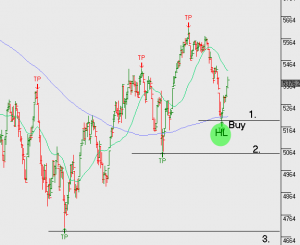
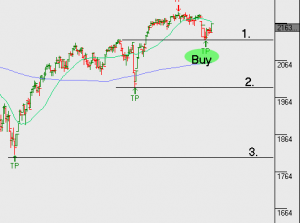
Below, I’ve identified key technical levels to watch in both the XJO and the S&P500 as a mechanism for remaining long the market with a bias toward buy side opportunities. Should the indexes reverse and trade below these levels, we shift our thinking to a more balanced view and begin identifying short trades to help balance the risk in client portfolios.

I’ve used simple numbering 1, 2 & 3, (in charts below), to identify the key breakdown levels that warrant a shift in strategy. To recap, we remain almost exclusively  exposed to long positions, with a balanced allocation across asset classes, and hold around 20 preferred names within the ASX top 50 index. In some cases we’ve allowed 5 – 10% capital growth in certain names over coming months. In other names we’ve sold tight covered calls to maximise the income from dividends and call option income.

If the market reverses through the first of our levels, (indicated by 1), we will start shifting our focus to short signals identified by our algorithm engines; which will then start to neutralise the long portfolio bias. When and if this happens, I’ll update you via the blog, otherwise, we continue to hold our “buy on the dip” position.

For more details you may wish to revisit the monthly strategy video posted earlier this week.

XJO 200 Index

xjo

S&P500 Index

sp500