Geopolitics Give Gold A Lift

Between increased hostilities in Syria, and a US Navy carrier group off the coast of Korea, geopolitical risk lifted Gold over $20.00 in overnight trade.

After trading down to $1195.00 on March 15th, the yellow metal has moved $80.00 higher and is now trading near $1275.00.

With momentum indicators approaching over bought levels, we see scope for a pullback to the $1265.00. However, over the next few weeks, a move back to the November 2nd high of $1310.00 looks like a reasonable target.

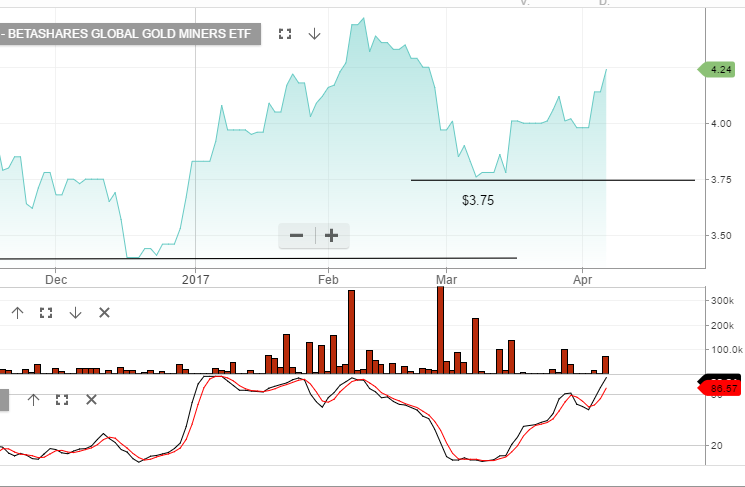
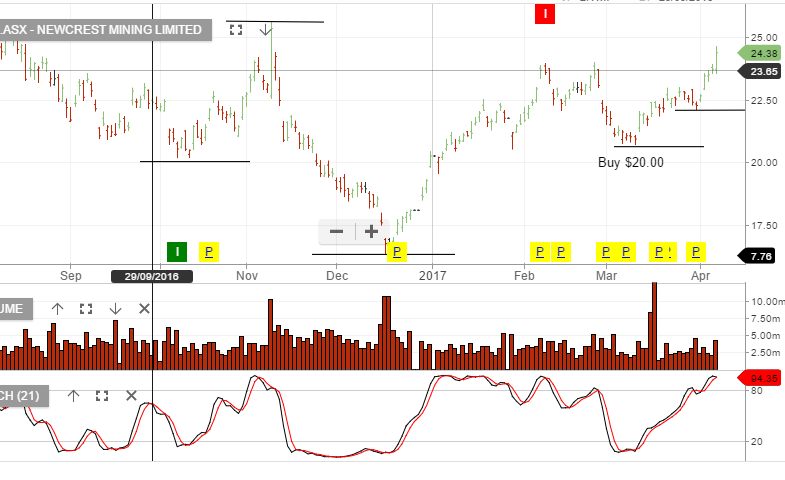
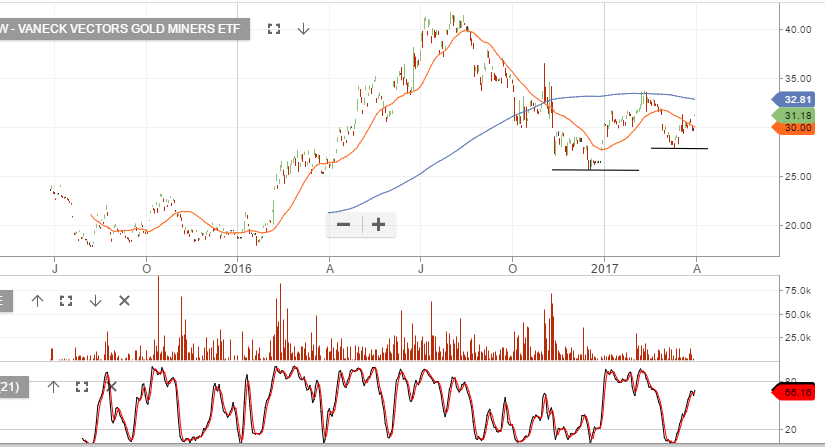
Over the last few weeks, we have been buying both shares and call options on Newcrest Mining and the GDX Gold Miners ETF.
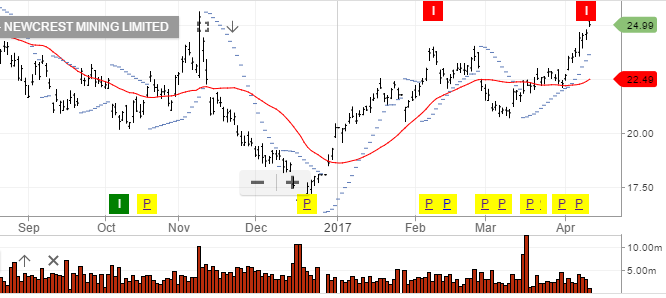
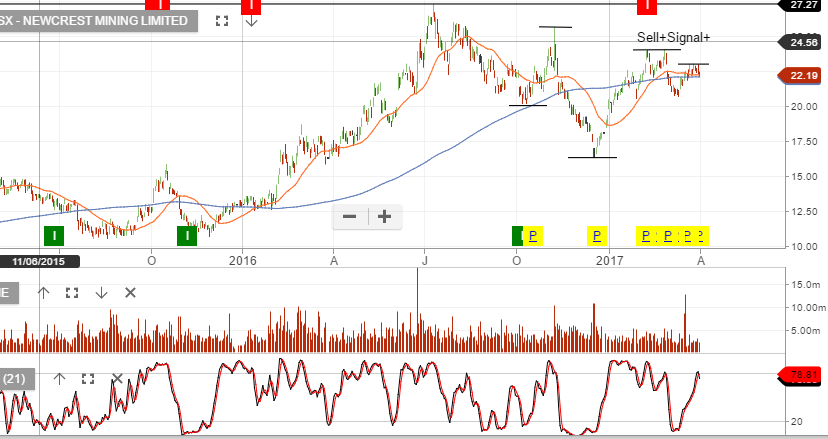
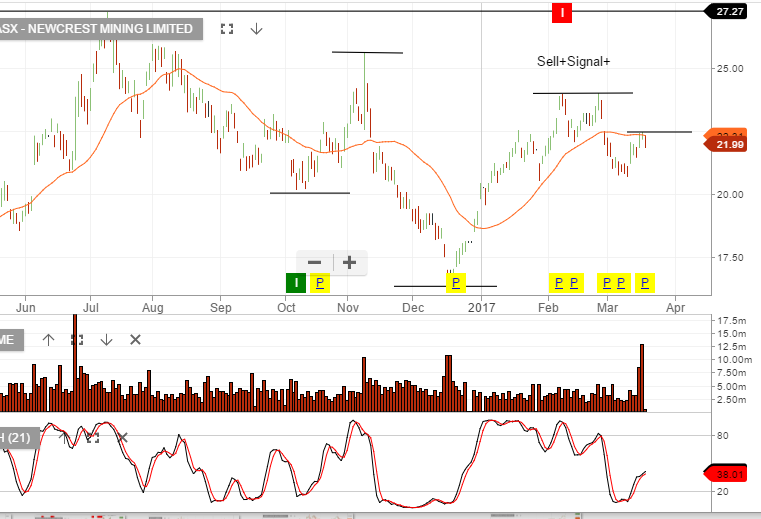
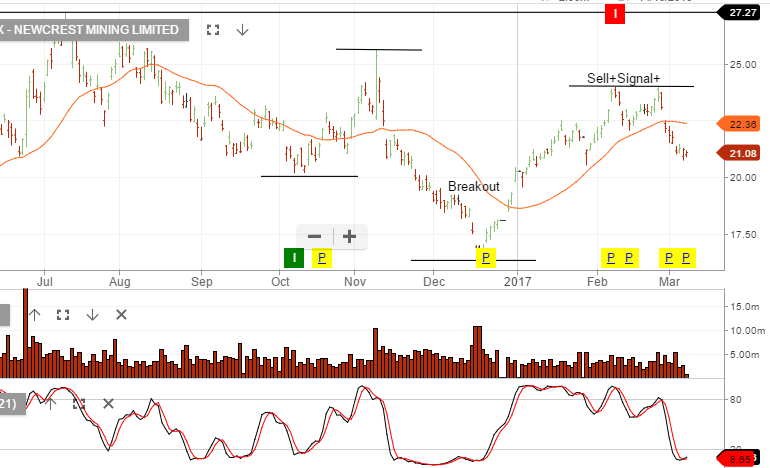
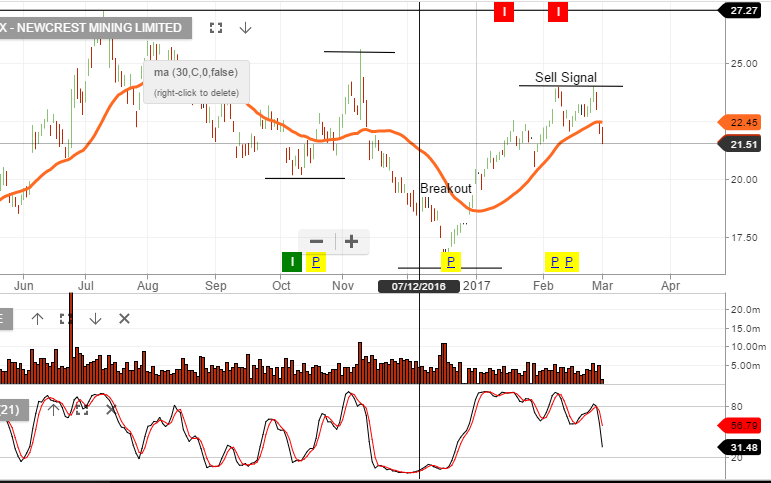
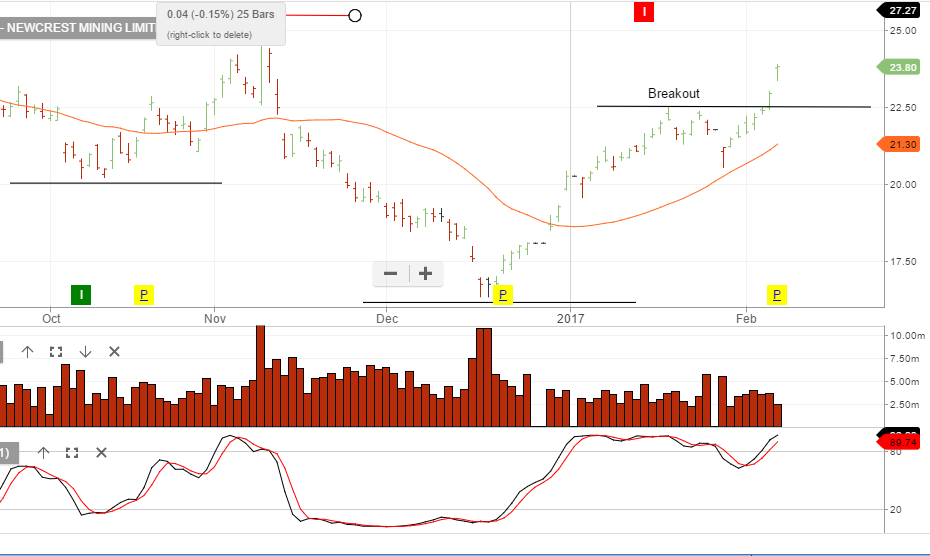
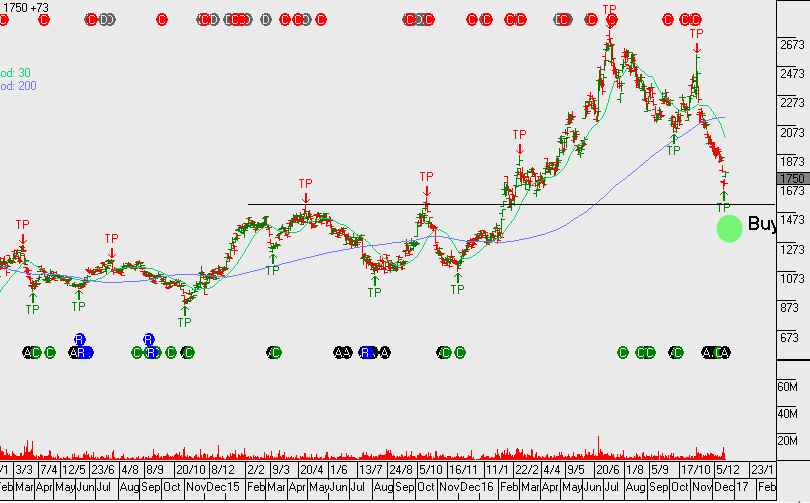
Chart Newcrest

Buy The Dip in Gold

After a sharp rally on the back of equity weakness last week, Gold has consolidated above the $1240.00 level.

The technical picture is still constructive as the yellow metal is still above the 30-day moving average  at $1234.00 and the RSI reading at just above 56.00.

There are still many global stock indexes trading at elevated prices. The market has proven that the inverse correlation of Gold moving higher, as stocks move lower, still intact.

We see scope for a test of the $1235.00 level before trading higher next week. Our medium-term target is the November 10th high of $1292.00.

Investors looking to profit on a move higher can look at either the Vectors Gold Miners ETF (GDX), buying the dip in Newcrest Mining down to $22.00, or placing Newcrest Call Option strategies.

Chart – GDX
Chart – NCM

Gold/Newcrest Break Higher

As Wall Street stocks moved lower, gold prices continued to attract “safe haven” flows.

As mentioned in our earlier post, the yellow metal met technical resistance at the 30-day moving average price of $1230.00 last Friday.

However, with global equities correcting from recent highs, the next key resistance level will be the February 27th high of $1263.00.

Similarly, shares of Newcrest Mining have broken above the 30-day moving average and now look set to test the February 23rd high at $23.45

GOLD/Newcrest Approach Resistance Levels

Both the share price of Newcrest Mining and Spot Gold rallied sharply last week.

As such, both are now trading against the key technical resistance at the 30-day moving average areas of $22.00 and $1230.00, respectfully.

Looking ahead, the question is whether the inverse correlation between global equity prices and Gold continues, and whether that will continue to lift the shares of Newcrest?

On Friday, the daily trading volume in Newcrest was 12.7 million shares.

This is more than twice the average daily turnover of 5.5 million and the largest volume day since 18.5 million shares were traded on June 24th, 2016.

Generally, an up-day in the share price, on expanding volume, is a positive sign for further gains in the share price.

At this point, we don’t have a buy signal from the ALGO engine but will watch the price action closely.

Chart – NCM

Gold Weakness Pressures Newcrest lower

After reaching a high of $1263.00 on February 27th, the price of Gold has dropped over $45.00 to close today at $1216. 00.

Technically, this price represents the first daily close below the 30-day moving average since January 2nd, and points to the next key support level at $1200.00.

On February 8th, the Investor Signals Algo engine generated a short signal on Newcrest Mining at $23.95. Investors who were holding long positions were given the signal and had the opportunity to sell covered calls, or sell the shares outright.

Shares of Newcrest are now trading near initial support at $21.00.

However, with momentum indicators pointing lower, a realistic near-term target could be found near the former “double-top” high at $20.40.

Chart – NCM

Gold Catches Safe-Haven Bid

Spot Gold prices hit a 3-month high of USD 1,235.00 as geopolitical tensions increased the yellow metal’s safe haven appeal.

Political uncertainty regarding upcoming elections in Europe, the US and Iran exchanging threats and unstable banking sectors in Italy and Greece have all added to investors’ interest in Gold.

From a technical perspective, the next key price target is at the November 11th high of USD 1292.00. We would suggest exiting long positions in that area.

Shares of Newcrest Mining have followed the gold price higher and have rallied over $3.50 during the last eight trading sessions. We expect to see the $24.50 level offer the next area of resistance and look to exit long positions in that range.

Chart – NCM


Gold: A Corrective Bounce

Gold has found initial support at the $1120.00 level and has posted a corrective move higher over the last two days.

The yellow metal is now approaching the technical downtrend line near $1155.00, which we feel will offer stiff resistance. The 30-day moving average is currently at $1186.00. The RSI has been in oversold territory below the 30.00 mark for over a month, so some price consolidation is expected before extending lower.

Newcrest Mining is currently 3.5% higher at 17.40. We view this move as corrective and would expect sellers to return at , or around, the 18.60 level.

Chart - NCM
Chart – NCM