It’s almost been a year since Donald Trump was elected to the White House.
One of the key promises Mr Trump made to voters during his campaign was for the “largest tax cut” since the early 1980’s.
Not including the vague leaks over the last three months, a tangible, nine-page brief of the tax reform plan was just released last Wednesday.
Just a few of the key features of the tax plan include: lowering the corporate tax rate from 35% to 20%, dropping the number of personal tax brackets from 5 to 3 and a one-time repatriation tax, designed to bring corporate profits back from overseas.
From a market perspective, it’s the repatriation tax that has the financial media the most excited.
It’s been estimated that US multi-national corporations have somewhere between $3.5 to $5 trillion domiciled offshore. The prospect of having these funds sent back to the USA, with a maximum tax rate 10%, is very bullish for both the USD and US stocks.
At this point, the biggest question for investors is: will this tax reform plan become law and have a positive impact on US equities and the USD, or will the proposal become another victim of the political gridlock which has permeated Washington DC since Mr Trump took office?
Over the last few days that the tax proposal has been out in the public, politicians from both sides of the aisle have criticized various provisions and changes to the tax code.
As expected, core Democrats are calling the plan a tax cut for the rich at the expense of the middle class, and the small group of Republican “deficit hawks” have refused to support the changes until they are scored by the Congressional Budget Office (CBO).
In this context, “scoring” means calculating how the proposed changes to the tax code will impact the federal deficit, relative to the spending and entitlement costs allocated in the Federal budget.
In our view, it’s this last point which is the biggest hurdle to any meaningful tax reform this year. The simple problem is that the CBO can’t score the tax plan against the 2018 Federal budget……….because there is no 2018 budget.
In fact, there has not been a legislated budget passed in the US since 2009, with the Federal government currently operating under another Continuing Resolution which will expire in December.
This means that before any tax reform plan can move to the Congress for a vote, a budget for 2018 must be passed.
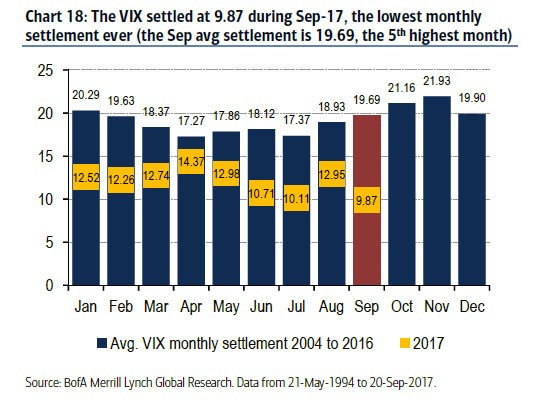
The chart below illustrates the monthly closing price of the VIX volatility Index in 2017, relative to the average prices dating back to 2004. It’s clear that the monthly volatility has been below trend in every month this year, with September closing almost 10 big figures lower than the average.
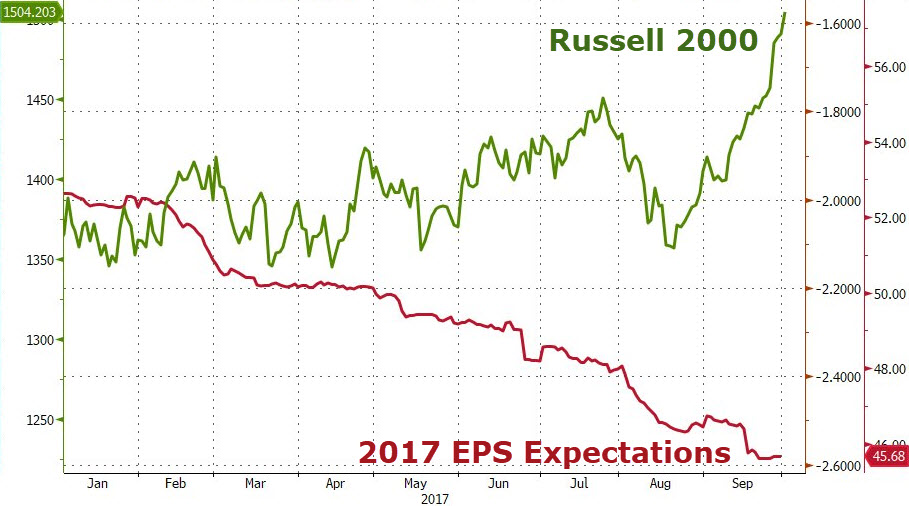
With equity valuations at extreme levels versus forward earnings per share, we expect some market event to trigger an increase in volatility back to the historic averages. However, at this point, we don’t expect that event to be the recently released tax reform proposal.
Monthly VIX Index
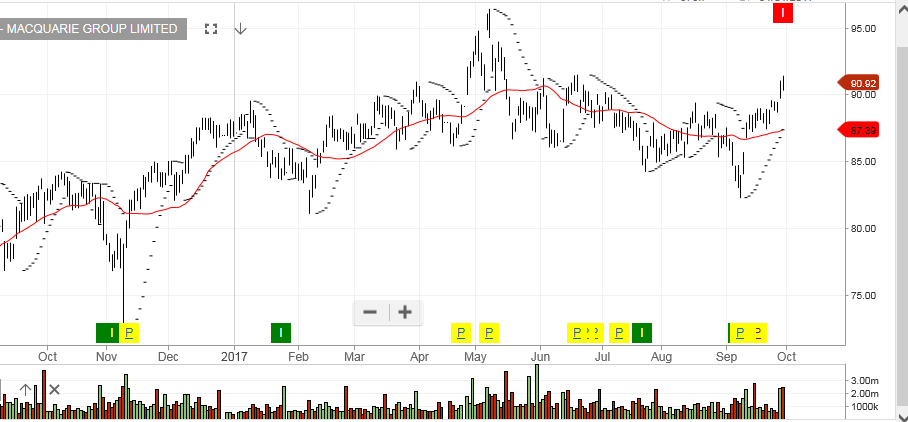 Macquarie Group
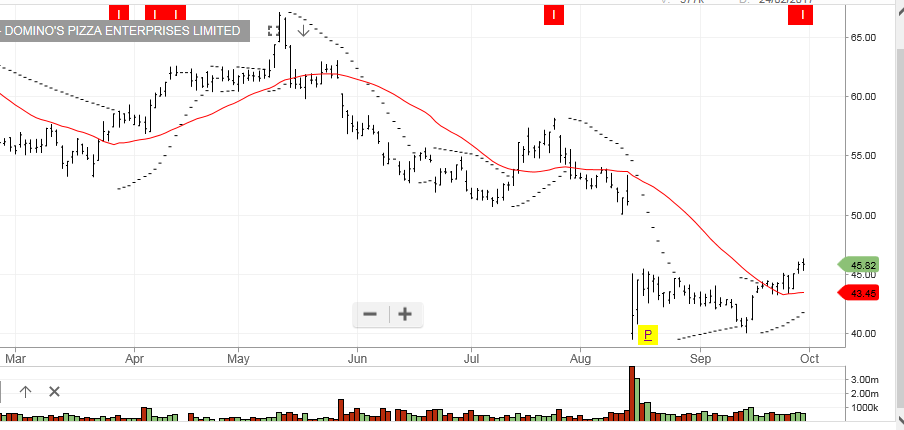 Domino’s Pizza