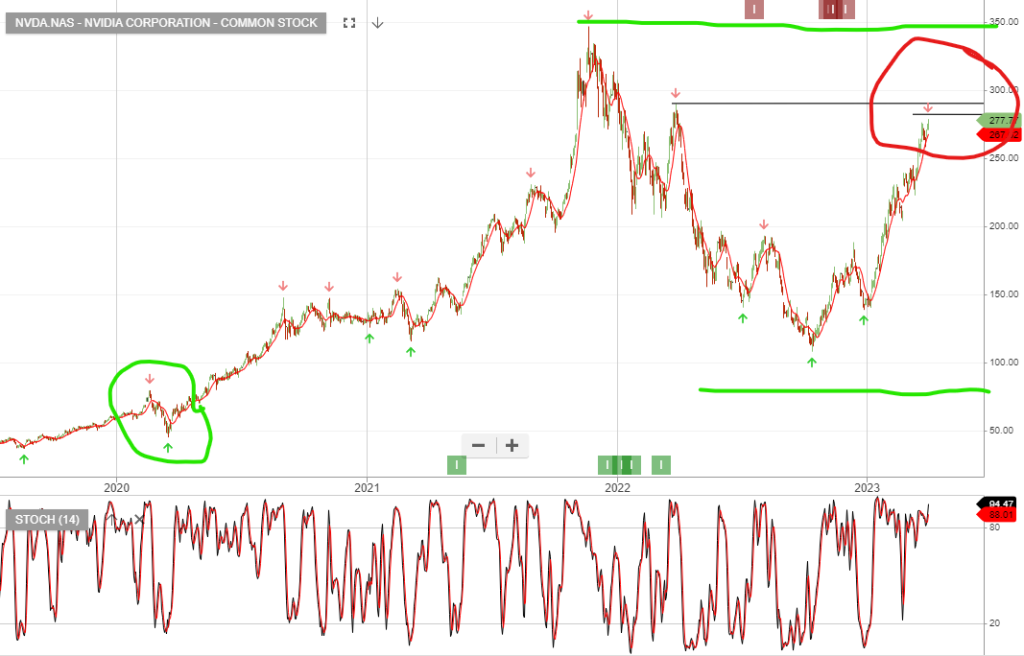
We begin exploring enterprise values, which are multiples of the pre covid levels and ask if they’re overvalued. After a closer look at Nvidia, we conclude it looks expensive and investors are overpaying for future growth.

Market consensus is Nvidia is going to grow earnings by 27% in the next 12 months, whereas, earnings have grown by 19% per year over the past 5 years and net profit margins appear to be contracting.
At a PE ratio of 156x earnings and a price-to-sales ratio of 25x, (US semiconductor industry average is 3.7x), Nvidia looks expensive.
NVDA has more cash than its total debt, and earns more interest than it pays, so coverage of interest payments is not a concern. NVDA insiders have only sold shares in the past 3 months.
EPS FY24 estimated @ $4.54.
EPS FY25 estimated @ $6.04.
EPS FY26 estimated @ $8.72.
Free Cash Flow in millions FY24 estimated $12,124.
Free Cash Flow in millions FY25 estimated $14,086.
Free Cash Flow in millions FY26 estimated $15,204.