The graph of the S&P500 shows a continuation of the bullish move and a recent Algo Engine buy signal at the January low. Short-term we have faltering momentum with overhead resistance at 4590 in the S&P500 index.
Join Monday night’s webinar, where I’ll provide detail on the technical patterns that traders and investors should be watching.
Free trial: https://www.investorsignals.com/register
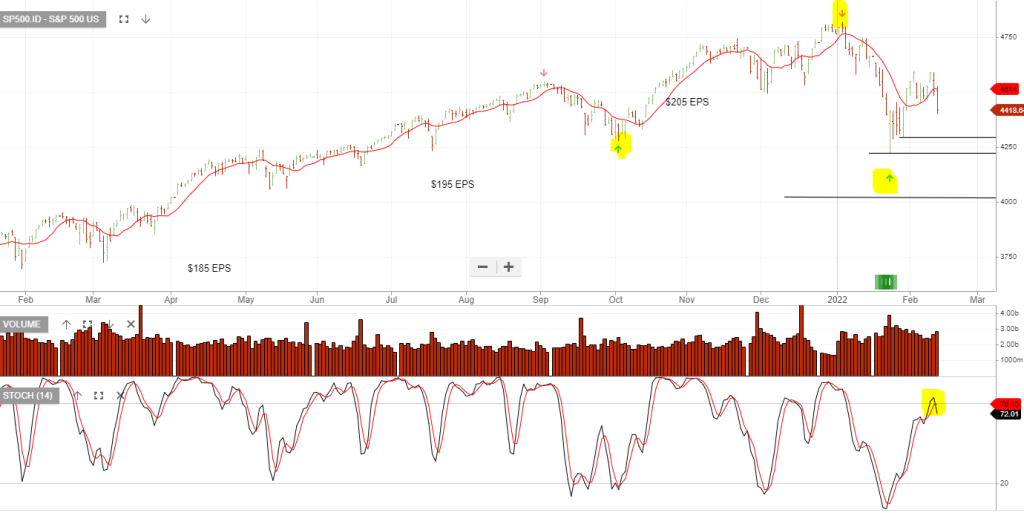
Traders will be monitoring next week’s price action based on the above pattern.