Black Monday 2011, Revisited

Just over  six years ago, August the 2nd 2011 to be exact, the US Congress avoided a Sovereign default and finally reached an agreement to raise the US debt ceiling from $14.29 trillion to  $15.77 trillion.

The legislation was called the “Budget Control Act of 2011”, and was signed on the same day by President Barack Obama.

During the negotiations, credit agencies, Moody’s, Fitch and Standard and Poor’s all advised lawmakers that the US AAA credit rating was going to be reviewed regardless of the debt ceiling legislation.

After the market closed on Friday, August 5th, several rating agencies downgraded the US credit rating to AA+ .

This triggered a massive selloff on Monday, August 8th,  where The NASDAQ Composite Index fell 174.72 points (-6.90%), the SP 500 Index shed 79.92 points (-6.66%), and the Dow Jones 30 Index lost 634.76 points (-5.55%).

The aggregate loss on the day was over $1 trillion.

As the chart below illustrates, the fall out from the 2011 debt ceiling crisis led to the SP 500 losing 208 points, or 16.1% in just 6 trading days.

The US Congress and the White House have already commenced discussions about raising the debt limit from the current level of $19.80 trillion, with a September 29th deadline.

Considering the market’s inflated valuations based on tax cuts and infrastructure spending, domestic issues with consumer credit and autos loans, and the escalation of geopolitical risks, we suggest caution that this time the US equity market sell off could be much greater.
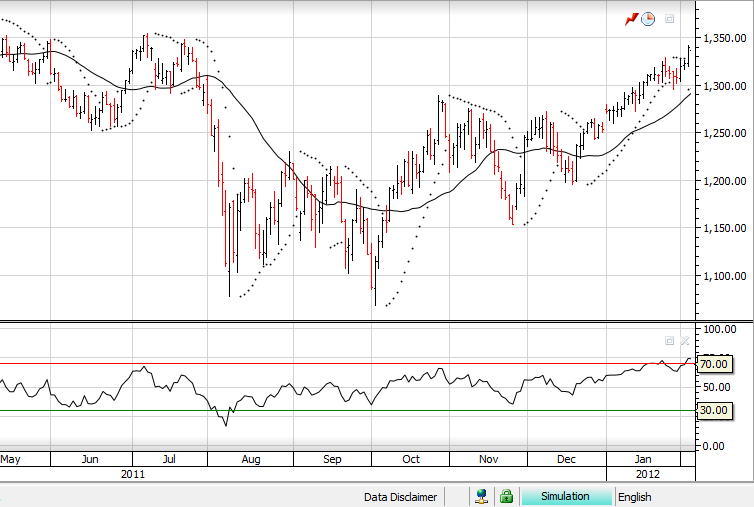
 

SP 500 August 2011.
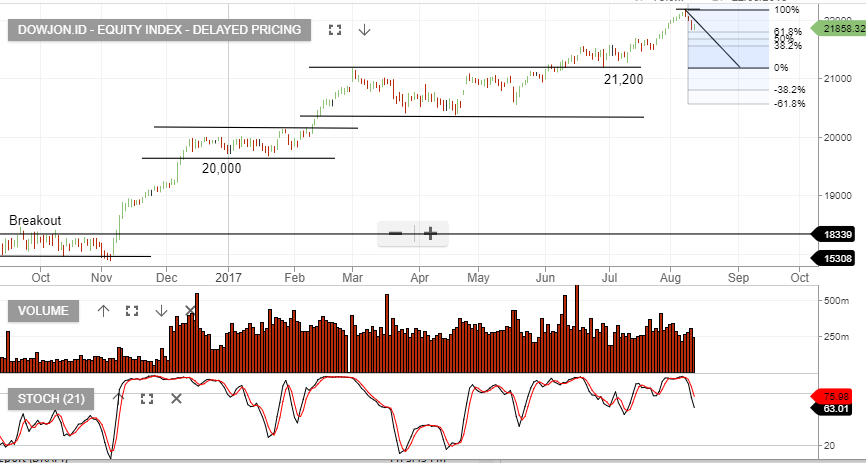
 

Chart Update – Dow Jones Index

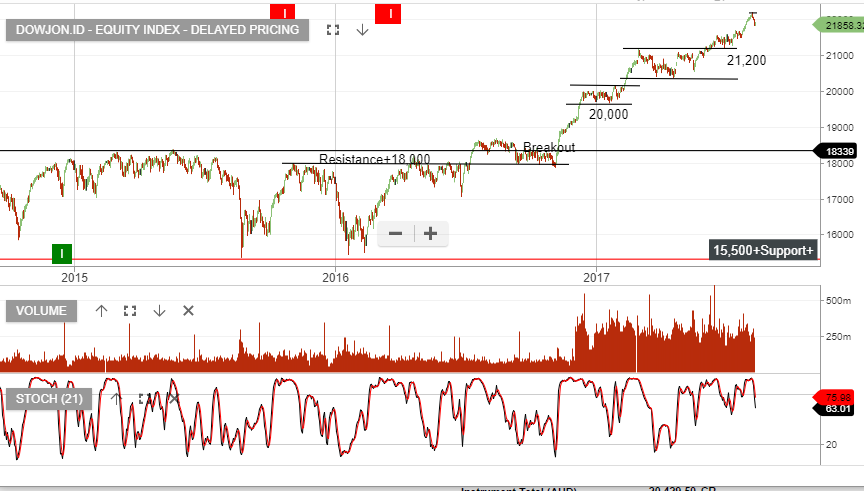
The chart below of the Dow Jones Index illustrates the selling pressure that is now building, in what has to be viewed as an overpriced market, relative to the risks which lie ahead.

The short-term momentum indicators have turned negative and we remain cautious on banks, property developers, consumer discretionary & companies that are trading on bubble level PE ratios.

Chart – Dow Jones
Chart – Dow Jones


Telstra Shares Firm In Front Of Earnings Report

Telstra will announce its earnings report this Thursday, August 17th.

The Telco giant is expected to maintain its 15.5 cents per share dividend, which will take its FY 2017 total dividend to 31 cents per share.

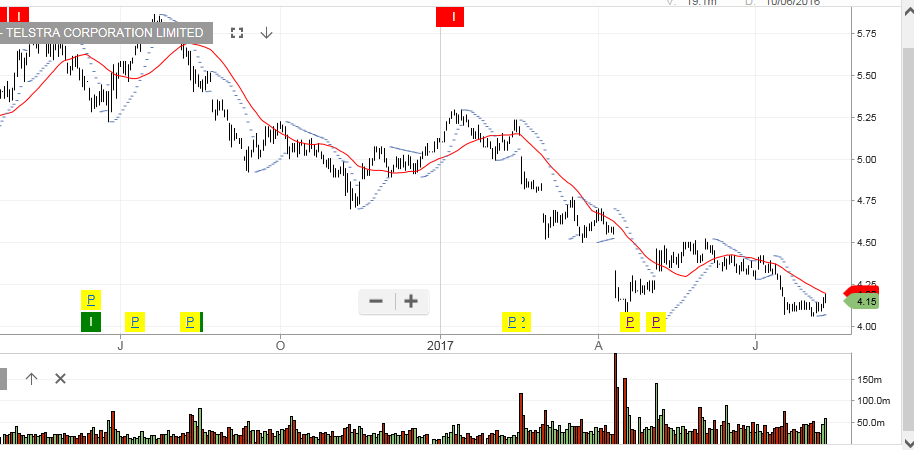
At the current share price of $4.15, this pencils out to a dividend yield of 7.4%, which is respectable in the current market environment.

Some analysts expect TLS to cut their dividend guidance into 2018 as the government cuts the NBN related payments, and may rule unfavorably on the unsettled bandwidth sharing plan.

However, considering the share price has dropped over $1.00 since the beginning of the year, and the recent price action has shown good support at $4.00, we consider the risk asymmetrical to the topside over the medium term.

As such, we view TLS as a good dividend play with a medium-term target of $4.80.

Telstra

Wall Street Wobbles On Geopolitical Risk

The S&P 500 dropped 1.45% last night, with the other major indices down over 1%, as investors sold shares amid an escalation of the war of words between the USA and North Korea.

Technology and Financials were the worst hit posting their worst day in three months. Goldman Sachs fell 2.4% as part of a weaker banking sector.

We can recap the the overall market performance as follows:

Nasdaq, Dow, S&P, Small Caps had their worst day in 3 months (to one month lows)

High-Yield Bonds worst 3-day move in 5 months.            

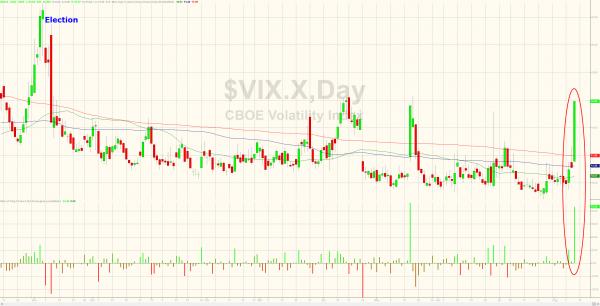
VIX volatility index posts its biggest 3-day spike since Aug 2015         

Gold’s best 3-day rally in 3 months to $1292.00

These bullet points are just a few examples of the heighten volatility we can expect in global financial markets going into the weekend.

VIX Volatility Index 


Algo Sell Signal – Goldman Sachs & General Electric

Our Algo Engine has triggered a sell signal in Goldman Sachs.

We maintain a negative outlook and advise running a stop-loss should the price action trade above the signal high of $235.

Chart – GS

Following the Algo Engine short signal in General Electric, the price action continues to carve-out lower levels.

Should we see GE trade down to $22, we would consider this price target as an oversold and  providing a suitable entry point for new long exposure.

Chart – GE


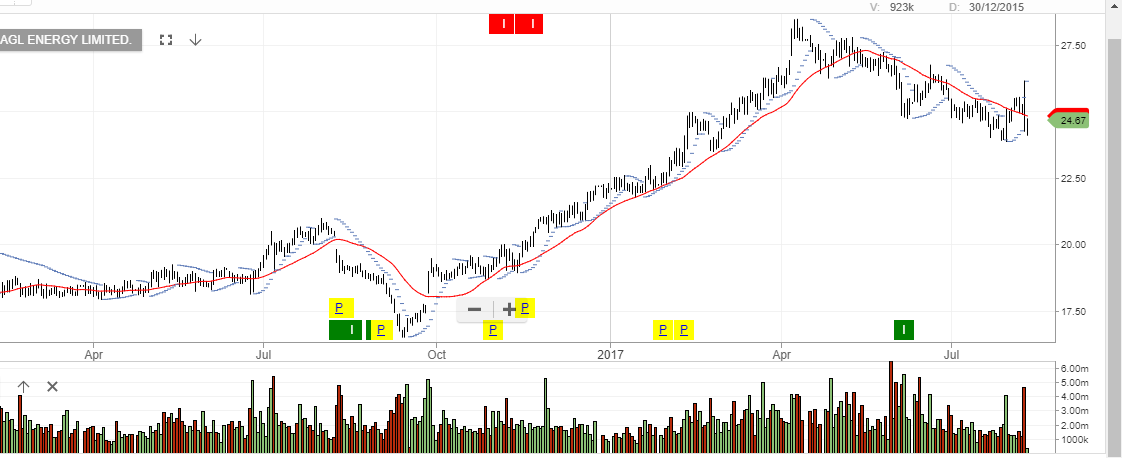
AGL – FY18 Guidance

AGL Energy recorded a solid FY17 NPAT.  

However, the market has reacted negatively to the board de-prioritised capital management. This has happened less than 12 months after launching its buy-back program.

AGL provided FY18 Underlying NPAT guidance in the range of $940-$1,040m. Earnings growth forecast is driven predominantly by higher wholesale electricity prices.

FY18 EPS increases from $1.20 in FY17 to $1.40, placing AGL on a forward yield of 4.6%

We have previously expressed our concerns with regards to AGL being overvalued and we continue to maintain our $22 price target.

AGL