As the major US stock indexes gyrate on fundamental economic reports and political developments relating to tax reform and debt ceiling legislation, many technical indicators are reflecting the deterioration of upside price momentum.
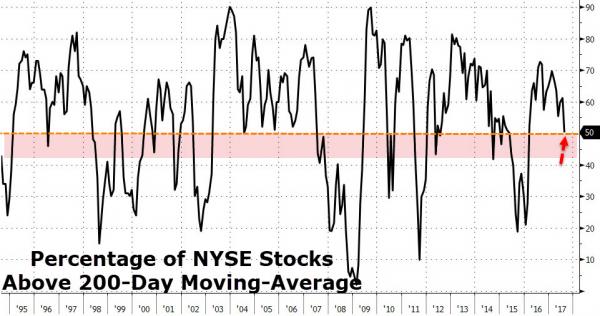
The chart below illustrates that the percentage of NYSE stocks trading above their 200-day moving average has decreased at a brisk pace over the last month.
When this indicator moves below 50%, it is saying that fewer stocks are supporting the overall index price level.
Historically, this has resulted in at least a 5% correction in the SP 500 over the near-term.
On that basis, the 4-week target for the SP 500 would be in the low 2300.00 area.
 NYSE Breadth