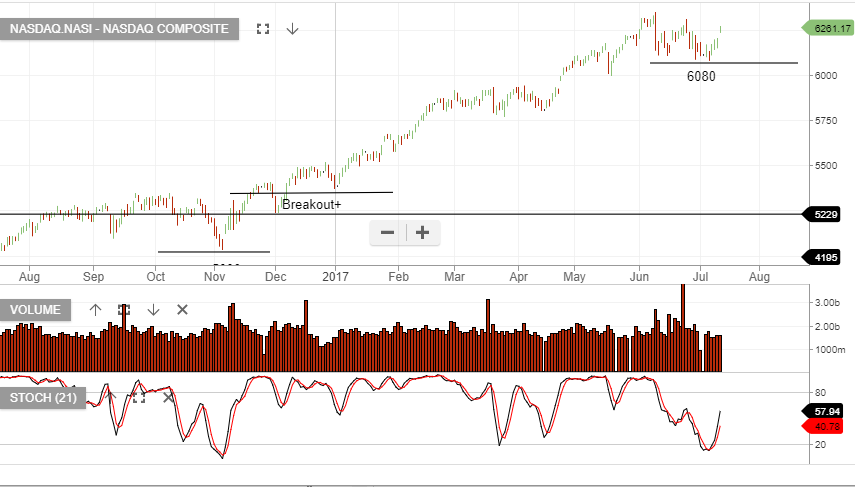
The Dow Jones and NASDAQ charts below show the indices continuing with the “higher high and higher low” formation.
The XJO shows a slightly more bearish pattern, as our local market struggles below the recent 5850 high.


The Dow Jones and NASDAQ charts below show the indices continuing with the “higher high and higher low” formation.
The XJO shows a slightly more bearish pattern, as our local market struggles below the recent 5850 high.
Level 17 Chifley Tower
2 Chifley Square
Sydney, NSW 2000
1300 614 002
Investor Signals Pty Ltd
ABN 44 143 555 453
Or start a free thirty day trial for our full service, which includes our ASX Research.