Gold/Newcrest Break Higher

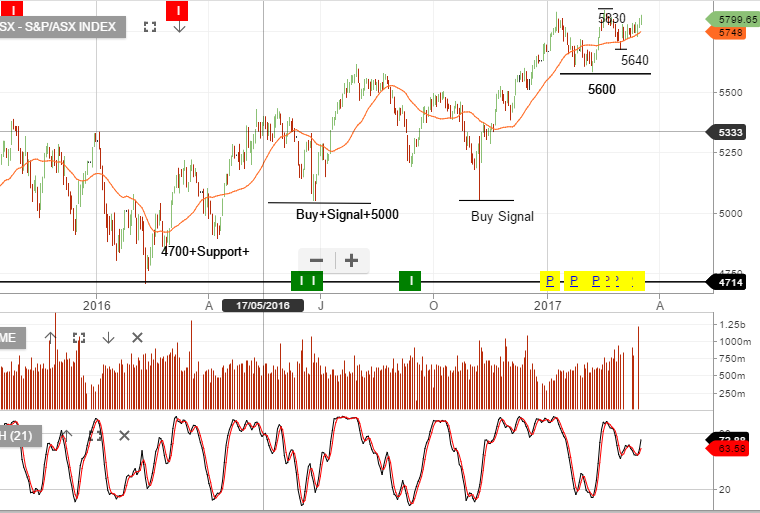
As Wall Street stocks moved lower, gold prices continued to attract “safe haven” flows.

As mentioned in our earlier post, the yellow metal met technical resistance at the 30-day moving average price of $1230.00 last Friday.

However, with global equities correcting from recent highs, the next key resistance level will be the February 27th high of $1263.00.

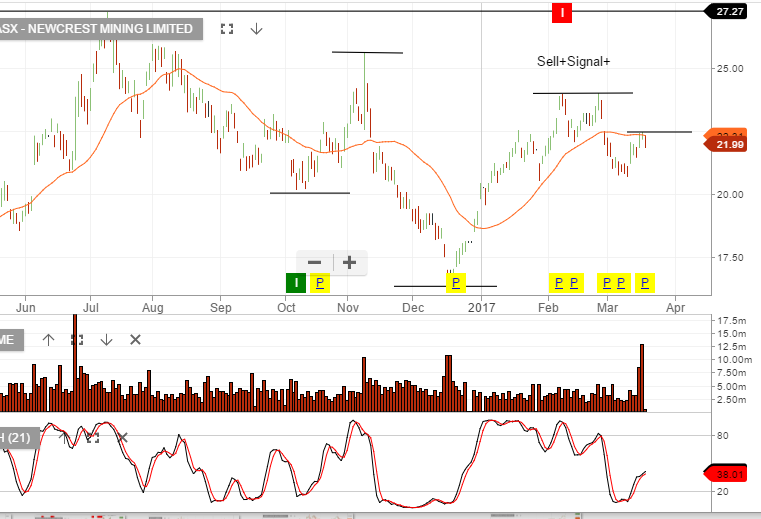
Similarly, shares of Newcrest Mining have broken above the 30-day moving average and now look set to test the February 23rd high at $23.45
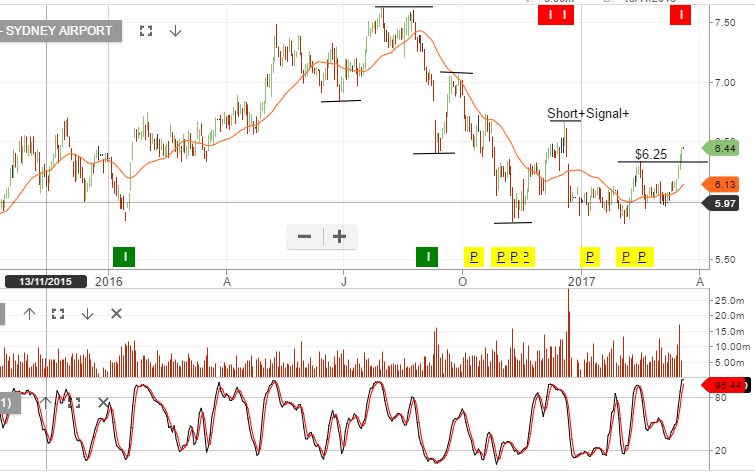
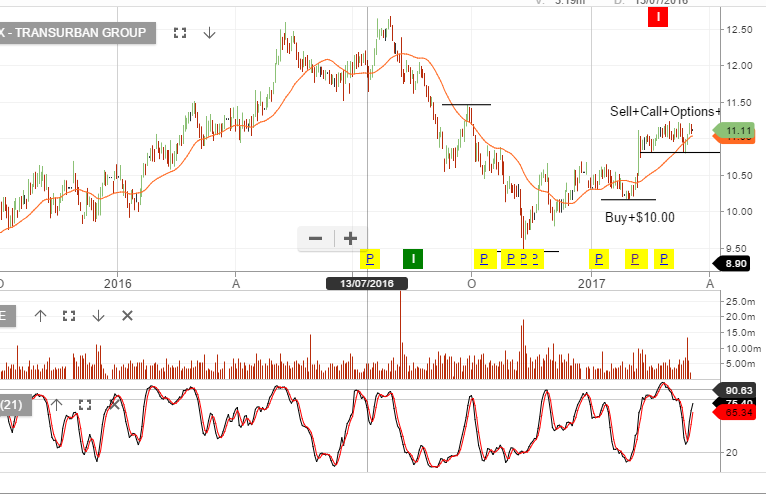
Algo Signal – SYD & TCL

The Algo Engine flagged SYD as a short signal yesterday. At this stage, we’re thinking SYD trades sideways, (rather than lower), and consolidates heading into the June dividend.

With the stock at or near $6.50, it places SYD on a 5% yield and when complimented with a tight covered call, we’re able to generate 12% annualized cash flow. If price breakdowns below $6.25, we’ll reassess the strategy.

Utilities & REIT’s, (SYD & TCL), are benefiting from US yields retreating from recent highs.

Chart – SYD
Chart – TCL


GOLD/Newcrest Approach Resistance Levels

Both the share price of Newcrest Mining and Spot Gold rallied sharply last week.

As such, both are now trading against the key technical resistance at the 30-day moving average areas of $22.00 and $1230.00, respectfully.

Looking ahead, the question is whether the inverse correlation between global equity prices and Gold continues, and whether that will continue to lift the shares of Newcrest?

On Friday, the daily trading volume in Newcrest was 12.7 million shares.

This is more than twice the average daily turnover of 5.5 million and the largest volume day since 18.5 million shares were traded on June 24th, 2016.

Generally, an up-day in the share price, on expanding volume, is a positive sign for further gains in the share price.

At this point, we don’t have a buy signal from the ALGO engine but will watch the price action closely.

Chart – NCM