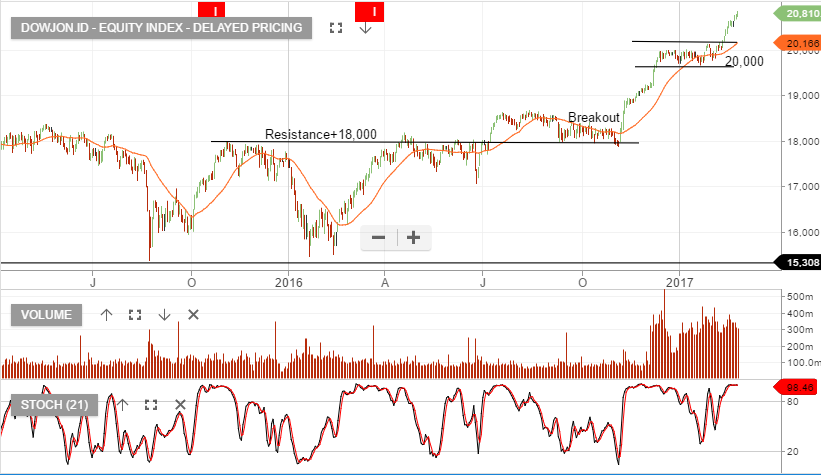
The US Federal Reserve will make their decision on interest rates this Thursday at 5 am, Sydney time.
An adjustment of 25 basis point to 1% for the Fed Funds target is now priced into the market.
As such, equity investors will be focused on the forward guidance about the pace and trajectory of US rates into 2018, and beyond.
This forward guidance will come in form of the FED’s “Dot Plots.” The dot plots are essentially a graphic reflection of where the FED members believe interest rates will be trading out until the year 2020.
For most equity investors, the key data will be how many rate hikes are expected to occur in 2017. When the FED raised the FED Funds target in December, the dot plots showed a consensus of three rates hikes during 2017.
The risk to the US equity market is that the FED dots plots are revised higher to include an additional rate hike for 2017.
If that’s the case, it’s reasonable to expect US stock indexes to trade lower, the USD to trade higher and US Treasury yields to continue to firm.
