Bendigo Bank

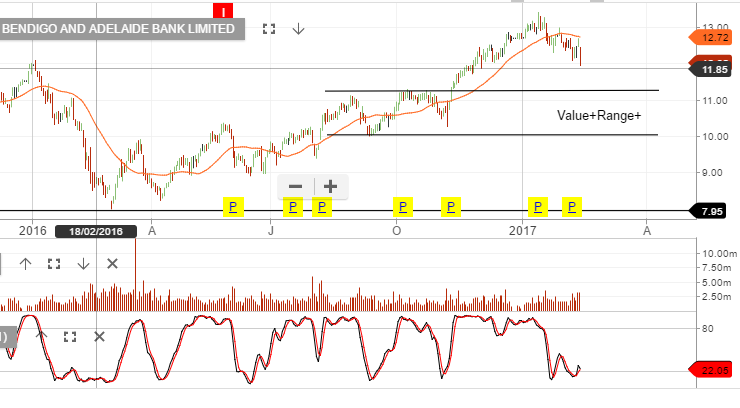
Bendigo Bank announced that they will keep its dividend steady at 34 cents per share, but a rise in bad and doubtful debts has pressured the stock 4% lower at the open of trade.

The bank posted a net profit of $209 million , up 0.1% from the previous period, and cash earnings were up 0.4% to $224.7 million. These results were pretty much inline with expectations.

However, after the bank reported bad and doubtful debts increased by $16.3 million to $39.8 million, the share price broke down through the recent support level at $12.25.

We believe that increased bad debts and loan provisions may be a recurring theme in the banking sector and limit share price appreciation across the big four banks.

Chart – BEN

AMCOR

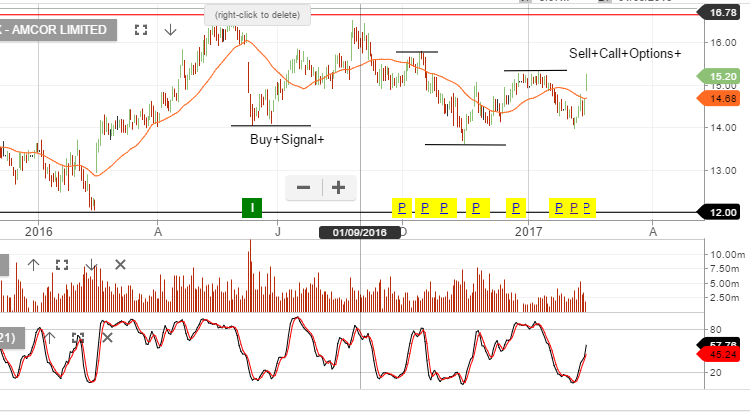
Shares of AMCOR are trading over 4% higher, to one-month high of $15.22, as the company reported a 3.8% rise in underlying net profit to USD 308 million.

The street had been expecting an underlying profit of USD 290 million.

Revenue rose 1.8% to USD 4.5 billion. AMCOR declared an interim dividend of USD 19.5 cents per share, compared to a USD 19 cent dividend during the same period last year.

AMCOR shares are up over 11% since trading as low as 13.65 in mid-November. Technical resistance will now be found in the $15.50 area.

Chart – AMC

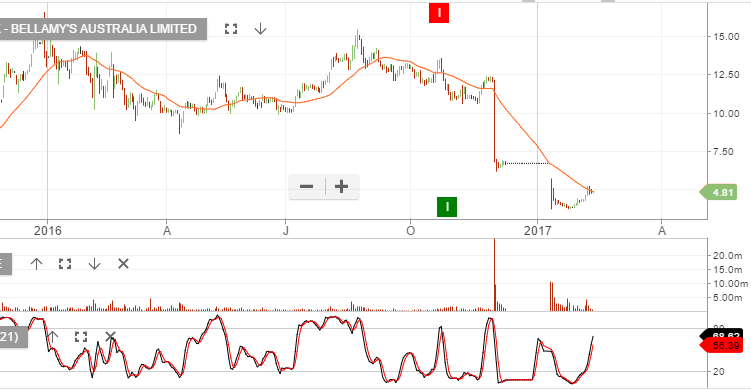
Bellamy’s

Shareholders of Bellamy’s have a had a pretty rough ride over the last couple of months.

The company is scheduled to report 1H17 results on February 27th, but rumors suggest they could release the report earlier.

The consensus forecast is for sales of $116 million, which would be 11% higher versus a year ago with EBITDA of $17 million, which would be down 11% on a year-on-year basis.

On balance, we feel that Bellamy’s is facing many company and industry specific issues, which may act as headwinds against a material rise in their share price.

However, should their planned restructuring strategy show evidence of working, the possibility of a  takeover is a real possibility in the medium-term.

Investors with an interest in the company should focus on the Extraordinary General meeting on February 28th to see what ,if any, changes to the board will be announced.

Chart – Bellamy’s

Bond Market Stress

Since the the beginning of 2015, there have only been two periods of time when the SP 500 has corrected lower by over 10%.

The first was from August 18 to the 24th, 2015. During these 5 trading days, the SP 500 fell from 2103 to 1831, 272 points, or 13%.

The second time was from December 30th, 2015 to January 20th, 2016. During these 18 trading days, the SP 500 dropped from 2074 to 1804, 270 points, or 13%

Of the many complex components that make up equity market pricing, and the fundamental events which can trigger widespread selling of global equities, it’s worthwhile to note that both of these periods of extreme stock market pressure were preceded by credit stress in regional bonds markets: The Greek bond market in 2015 and the Chinese bond market in early 2016.

Over the last three weeks, there have been early signs that these two bond markets may be in trouble again.

On January 20th, Greek 2-yr bond yields were trading at 6%. Last week they traded over 10% as negotiations with the EU creditors and the IMF are showing familiar acrimony and lack of progress.

This 400 basis point increase in yield reflects growing scepticism that any refinancing agreements will be reached at the EU finance minister’s meeting on February 20th.

As a point of reference, Greek  2-yr bonds were yielding over 25% when the contagion fears unsettled the market in 2015.

In China, the 2-yr yields have traded 40 basis points higher since the beginning of the year to just over 3%.

But more importantly, trading volumes in China’s bond futures market have exploded over the last two months as investors look to hedge the growing risks of rising rates and potential defaults. Turnover in the 2-yr to 10-yr Chinese bond curve has quadrupled since October as bond prices have dropped.

In early 2016, stress in China’s bond market caused investors to dump the Chinese Yuan, which lost over 7.5% during the broad global equity market correction.

It’s not our base case that global equity markets are drawing close to a sharp correction lower.

However, we feel it’s important that investors are cognizant about the state of markets which have triggered such events in the past. In short, the time to make a plan for a market sell off is before it happens, not while it’s happening.

As such, Investor Signals can offer investors trading access to local and global bond markets, International stocks and credit markets, In addition to ASX equities and derivatives.
Telstra & TPG Valuation Review

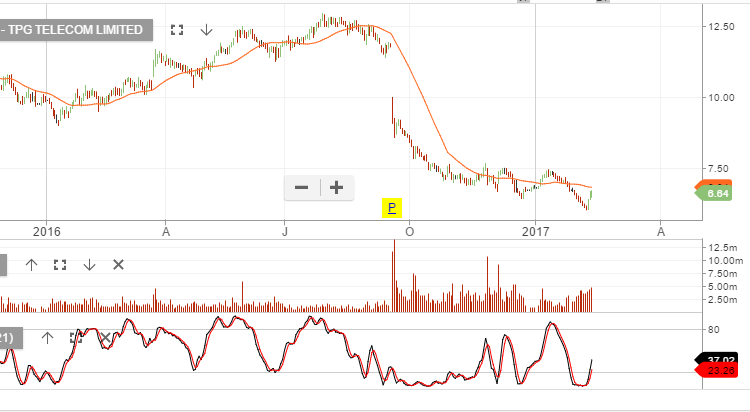
Until October 2016, TPG Telecom was the fast growing telco with almost 20% EPS growth whilst trading on a low 2% yield.

Then came the earnings update and the company suggested future EPS growth will be more like 5%. If Telstra is growing earnings at 3 – 5% and paying a 6% yield, why would an investor buy TPG on a substantially different yield or valuation?

You just wouldn’t. As such,  we’ve watched TPG sell-off from $12.50 to $6.20 and the stock is now back on a  4.5% yield. TPG will likely find buying support now and the market is hoping EPS growth will creep higher into the range of 5 – 10% to support the yield differential with Telstra.

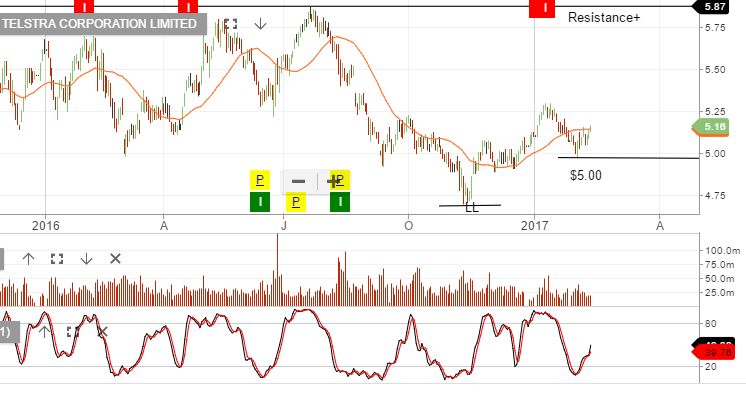
We’ve been buyers of Telstra at sub $5.00 and we’re looking for the stock to trade $5.50 before evaluating a covered call option strategy.


Chart – Telstra
Chart – TPG Telecom


Chart Update – Banks

Goldman Sachs and JP Morgan remain within the consolidation range which began in early December.

In our local market we’ve seen BOQ & BEN sell off 10% from the January peak-to-trough. NAB reported weak revenue growth and higher than expected expenses, leading to a 1% fall in profit.

CBA report their half year results on Wednesday, we expect NPAT of $4.8b and DPS $2.00. 3 – 5% underlying EPS growth on the same time last year.

ANZ corrected 10% from peak-to-trough.

We’ll watch the US banks in the weeks ahead to see which way they break from their current consolidation range.

Chart – Goldman Sachs
Chart – JP Morgan
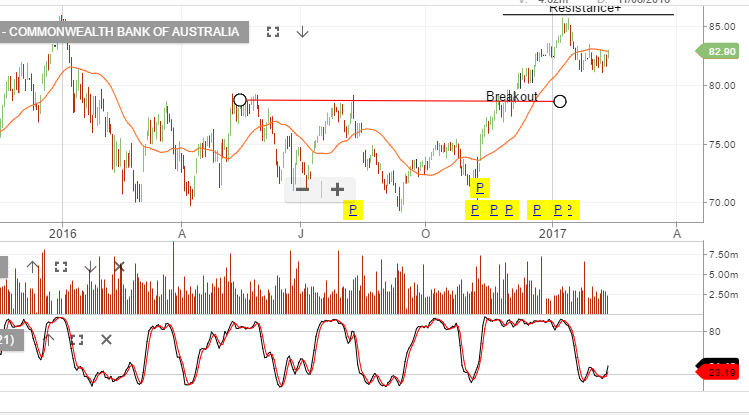
Chart – CBA


ETF WATCH: Australian Dollar Pointing Lower

The Australian Dollar is under pressure going into the weekend and in front of next Thursday’s key employment report.

This week’s RBA statement reflected a neutral stance regarding future interest rate policy, but the currency was mentioned as a potential headwind to Australia’s terms of trade should the AUD/USD continue to appreciate.

The tone of the RBA statement illustrates the bias the central bank has for a weaker AUD/USD as a means to help domestic exporters. In short, the RBA would much rather see the AUD/USD at .7000 than at .8000.

Technically, the AUD/USD has posted a lower high everyday this week after failing to break the .7700 level last Friday. The relative strength indicator (RSI) is rolling over and pointing lower at 60.50, which suggests range extension below .7500 in the near-term.

For investors who want to profit from a lower AUD/USD, the ASX offers two dynamic Exchange Traded Funds (ETFs): the BetaShare USD and the BetaShare YANK.

The USD is an unweighted, inverse unit trust which gains a percentage value tied to the AUD/USD. The YANK is also an inverse unit trust, but has a 2.5% weighting. This means that a 1% drop in the AUD/USD will see a 2.5% increase in the BetaShare YANK ETF.