XJO & Dow Jones – Chart Update

The XJO remains near recent resistance as more than 50% of top 200 companies have reported their earnings. Average reported revenue is up 3.4% on the same time last year and underlying average profits are up 6%.

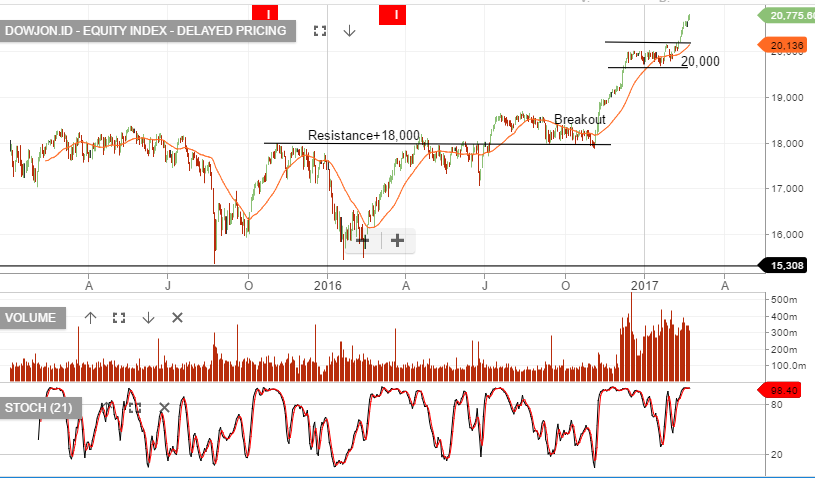
The Dow Jones chart shows the index breaking to the upside of the recent 20,000 consolidation range.

We remain cautious of the extended share price valuations and moderate underlying earnings growth.

For this reason we continue to tilt client portfolio’s towards defensive assets. We prefer reducing exposure to resource and banking stocks across the next quarter and increasing exposure to healthcare and consumer staples.

Our tight covered call overlay is boosting cash flow to 10 – 12% per year.
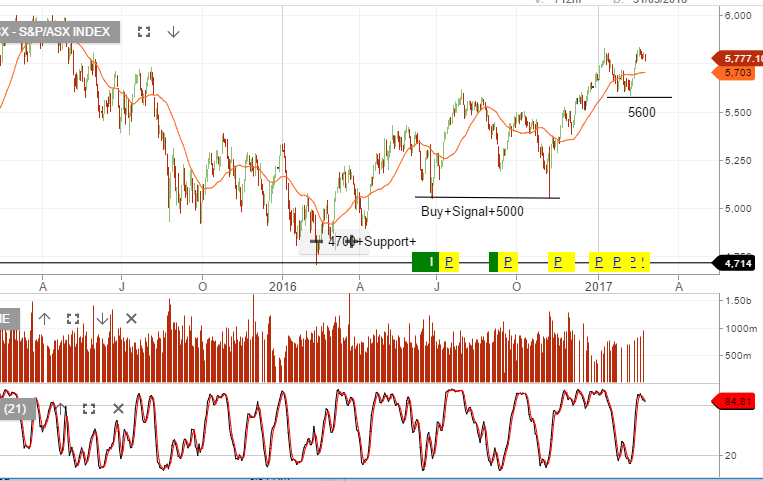
Chart – XJO
Chart – Dow Jones


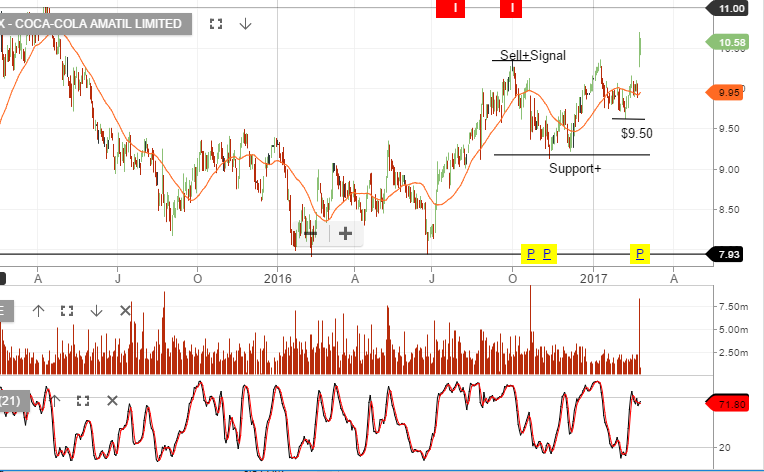
Coca Cola – How we’re generating 10%+ P/A

Coca Cola delivered  solid 2016 earnings result (+6.2%), which met market expectations. The announcement of a $350 million share buyback was  a positive surprise.

Structural pressures from shrinking CSD consumption will need to be off-set by continued cost out programs, such as the announced closure of the SA bottling plant.

A positive trend remains the growth in Indonesia/PNG, which delivered double-digit earnings over the past 12 months.

Looking into 2017, we expect revenue of $5.2billion, EBITDA $980m, EPS $0.58 and DPS of $0.48 placing the stock on a forward yield of 4.8%.

We own CCL in client portfolios and we’ve been selling tight covered call options to boost the cash flow to 10 – 12%+ on an annualised basis.

Chart – CCL


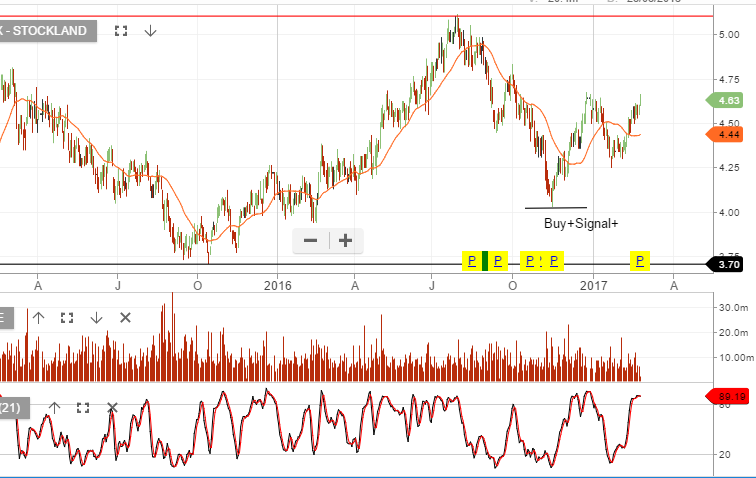
Stockland – 1H17 Earnings Release

Diversified REIT, Stockland Corporation, announced a 7.8% rise in its underlying earnings after posting record turnover in its residential division; primarily from the East coast of the country.

Stockland said revenue from operations reached $369 million, which is is tracking toward the upper end of its guidance for 5 to 7% revenue growth in 2017.

The company announced an interim dividend of 12.6 cents per share, compared to a 12.2 cent dividend for the same period last year.


Chart – SGP

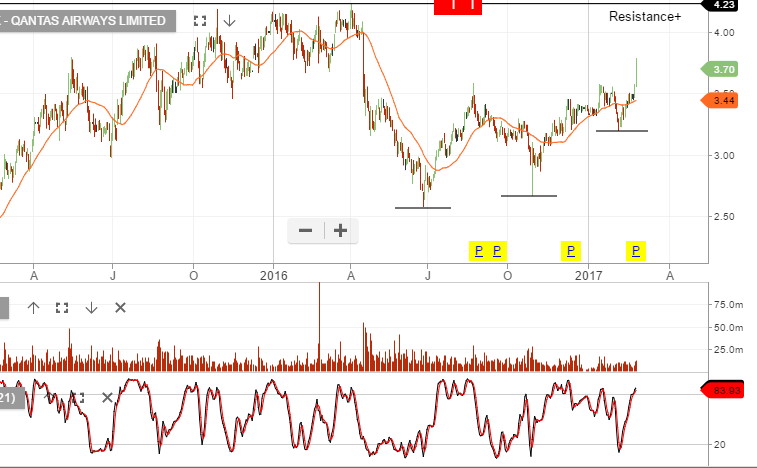
QANTAS – 1H17 Earnings Result

QANTAS announced first-half net profits fell to $515 million from $688 million during the same period last year.

A restructuring cost of $137 million was largely responsible for the profit miss, but the company also pointed to increased competition on international routes as a source of profit stress.

Underlying profit before tax fell 7.5% to $852 million for the six months to December 31st, which was higher than the company’s guidance range of $800 to $850 million.

That compares to the record profit of $921 million announced over the same period last year. Company officials didn’t provide any profit guidance for the 2016/17 period.

Qantas declared an interim dividend of 7 cents per shares (50% franked)

Chart – QAN


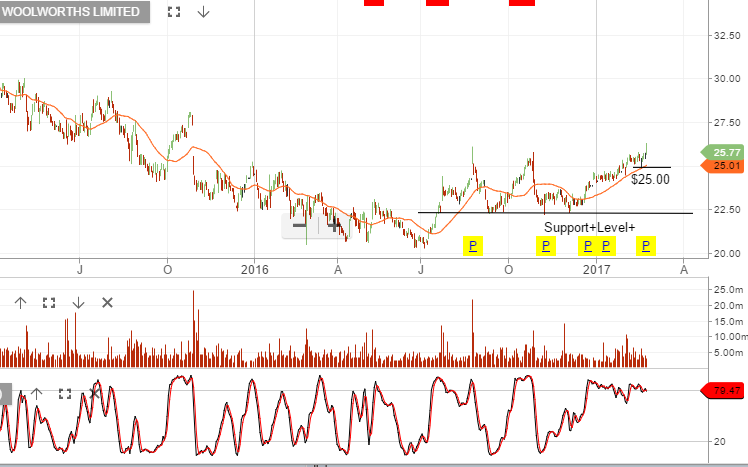
Woolworths

Even though Woolworth’s first-half profit outperformed rival Coles for the first time in seven years, the group’s earnings fell short of the street’s expectations.

For the six months ending December 31st, the group announced a profit of $725 million, up from a $972 million loss during the same time last year. market analysts were expecting a profit number of over $800 million.

Despite the solid earnings growth, the company cut its dividend to 34 cents per share, compared to 44 cents in the corresponding period last year. The street was expecting a dividend of 45 cents per share.

We’ve been selling European covered calls over WOW for an additional $0.72 per share credit, lifting the annualized yield to over 10%.

Chart – WOW

BHP – 1H17 Earnings

The rebound in Iron ore prices helped BHP post a first-half profit of AUD 4.2 billion. The resource giant announced its underlying profit for the six months to December 31st surged to USD 3.24 billion from USD 412 million during the same period a year ago.

The result was slightly better than the street’s forecast of USD 3.1 billion.

The company declared an interim dividend of 40 US cents per share, which is much better than the 16 US cents it paid a year ago. This takes into account the USD 155 million charge in relation to the Samarco dam failure in Brazil.

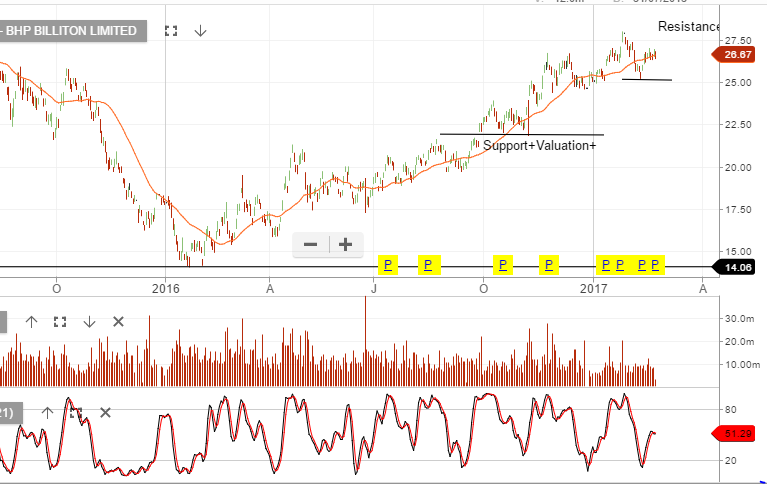
BHP’s bottom line has benefited from strong gains in commodity prices during H2 2016. Prices of Iron Ore more than doubled during 2016 on improved demand from China, while Crude Oil prices have recovered more than 40% from the multi-year lows hit in February last year.

The price correlation between BHP and Iron ore is very strong. Since posting a low of $14.10 in late January 2016, the share price has followed Iron Ore higher and almost doubled; reaching a high of $27.50 on January 25th.

We’ve been selling $27 calls over BHP for an additional $1.00 credit per share.

Chart – BHP