CSL: Fully Valued At Current Levels
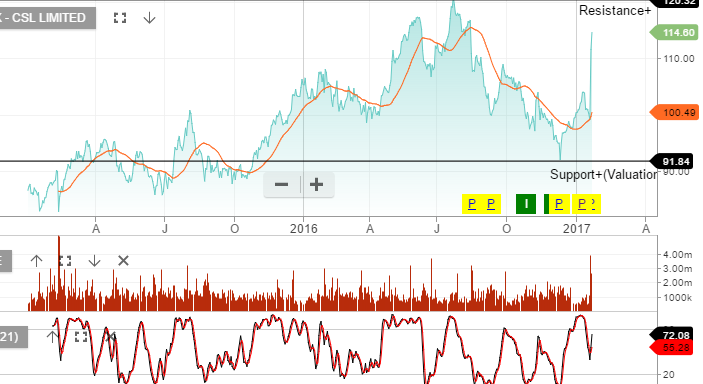
The share price of CSL jumped almost 14% to $115.90 this week after surprising the market with a big earnings upgrade.
After posting a first-half profit of about USD 800 million, CSL expects net profits for the year ending June 30th to grow between 18 to 20% on a constant currency basis. This forecast included a USD 20 million headwind from unfavorable currency conversions in the AUD/USD.
However, as positive as the headline and resultant share price rally appear, we suggest that this earnings news needs to be considered within a broader context.
18 months ago the F17 NPAT expectation was $ USD 1.7 billion, 6 months ago it was USD 1.5 billion and the first estimate 2 months ago was USD 1.28 billion.
In essence, this week’s news that the profit outlook has been raised to USD 1.33 billion is considerably lower than the earnings figures that CSL was expecting just 6 months ago…….yet the share price has moved from $90.00 to $114.00.
Based on industry assessments about potential pockets of competition within the immunoglobulins area, the forward earnings trajectory could be revised again over the next few months.
As such, we consider CSL in the $114.00 to 120.00 price range to be full-valued.
Our Algo Engine triggered a buy signal at or near the recent lows of $92.
Softer Revenue From General Electric
Shares in General Electric fell to a 1-month low of $30.30 after the company reported Q4 revenue which fell short of expectations.
The company’s Q4 earnings of 46 cents per share were in line with forecasts, but the revenue number of $33.08 billion was lower than the consensus estimate of $33.63 billion.
For calendar year 2016, GE delivered $1.49 of earnings per share, 1% organic growth and returned $30.5 billion to share holders through dividends and share buybacks.
We expect GE’s oil and gas operations merger with Baker Hughes will pay dividends throughout 2017 and would look for buyers to return near the November 4th support level at $27.50
It’s somewhat concerning the rollover in GE and likewise in top market cap US financials. We watch these signals closely as further evidence of structural share price weakness.
Our Algo Engine flagged the short signal setup in GE at or near the recent high of $32.

US Signals for January 20, 2017
Sorry, but this content is restricted to our members.
Please login with your account or register for a free trial. If your trial has expired, then you may renew it here.
If you are having an issue with your account, then please get in touch with us.
ASX Earnings – We’re Watching These Results
Here is a list of the first group of companies reporting where we’ll be reviewing the earnings results and keeping you informed….
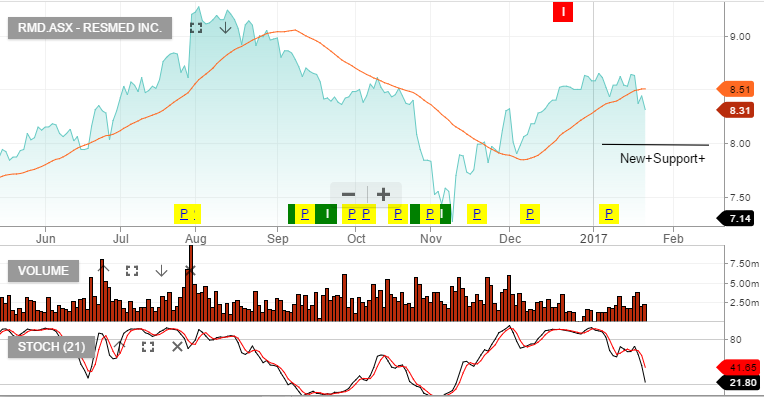
Resmed 24th Jan – Expecting better numbers following distributor de-stocking in the September quarter. New mask release should boost sales.
Tabcorp 2 Feb – Too early for any benefit from the Tatts acquisition, however, we’re looking for commentary on forecasts and cost savings.
James Hardie 2 Feb – US building cycle remains strong but we’re now cautious on James Hardie based on valuation concerns. Need to see EPS growth of 15%+
Transurban 7 Feb – We’re expecting strong free cash flow and minor dividend upgrades.
CIMIC 8 Feb – Expecting solid growth numbers and commentary on the integration outlook of UGL following the recent take-over
RIO 8 Feb – Good production numbers and we expect earnings to meet consensus forecast.
AGL 9 Feb – We’re concerned the market is too optimistic here and we will be looking at this result closely.
AMP 9 Feb – After the downgrades from the under-performing life insurance, we question what the future earnings look like. AMP as an asset manager is a very attractive business, we just need to re-establish the expected EPS growth rate.
Amcor 13 Feb – Looking for confirmation of 8% EPS growth
Ansell 13 Feb – FX impact could be a minor negative but the underlying business is improving. We’re looking for detail and timing on the pending corporate restructure strategy.
ASX Signals for January 20, 2017
Sorry, but this content is restricted to our members.
Please login with your account or register for a free trial. If your trial has expired, then you may renew it here.
If you are having an issue with your account, then please get in touch with us.
Woodside Petroleum – Valuation Review
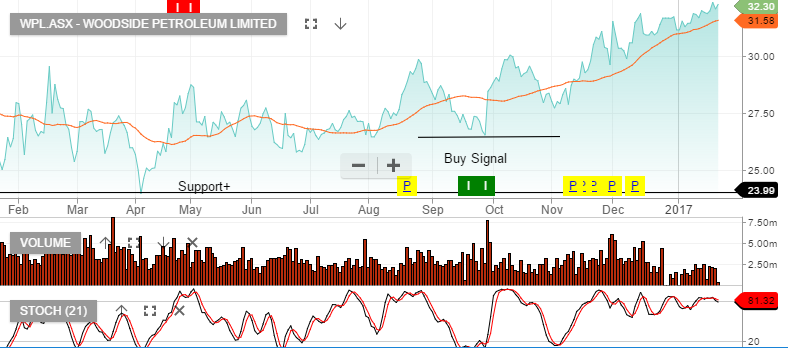
Woodside reported DecQ16 Production above market estimates on stronger LNG production. The result was driven by a stronger-than-expected performance from North-West Shelf & Pluto LNG.
The production beat helped DecQ16 revenue which increased to US$1 billion
CY17 production guidance will see volumes down 5- 10%. This is mainly due to the reduction in Woodside’s share of the NWS Joint venture.
2017 forecast revenue US$3.9b (flat on previous year), EBIT of US$1.5b, net profit of US$1b, EPS of US$1.30 places the stock on a forward yield of 4%.
Wesfarmers: Coal versus Coles
Given the number of diversified business units which make up Wesfarmers, we believe the most accurate method of share valuation is to look at performance of the sum of the businesses.
At this point, the valuation equation can be reduced to a simple question: Will the increased revenue from higher coal prices offset the loss of market share that Coles has given up to Woolworth’s?
We expect the resource division to generate first-half EBIT of $135 million, which is in the lower part of the $135-$140 million guidance band. Conversely, we have downgraded Coles’ sales growth which reflects industry checks suggesting Woolworth’s won the the Christmas-period grocery trade.
2017 forecast $69 billion, EBITDA $5.5 billion, net profit $2.8 billion, which will produce EPS of around $2.40 reflecting underlying growth of 5%. This places the stock on a forward P/E of 16X and a dividend yield of 5.5%.
ETF Watch – Inverse Index ETF’s
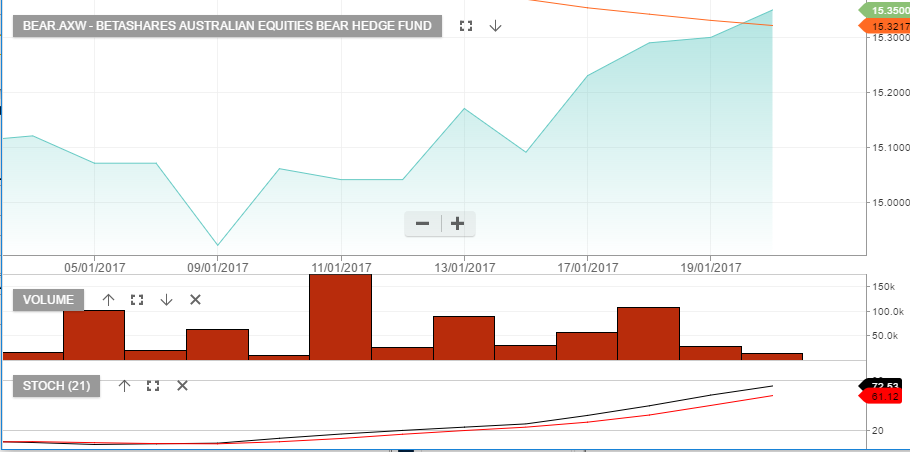
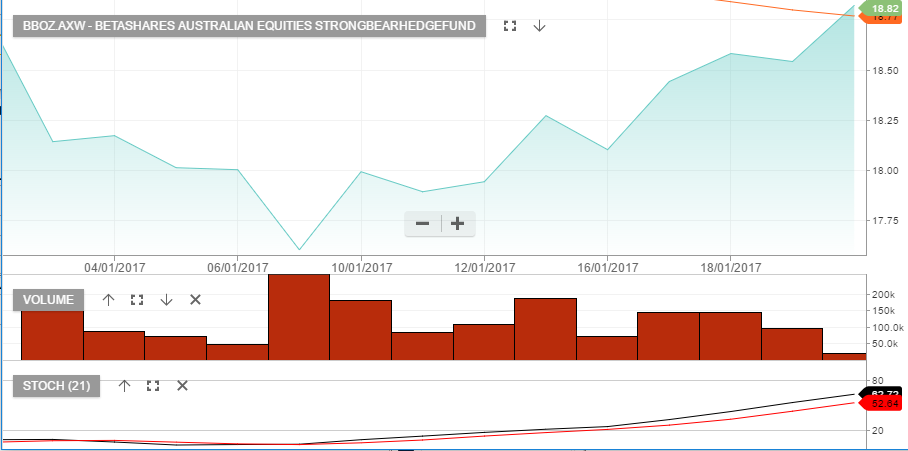
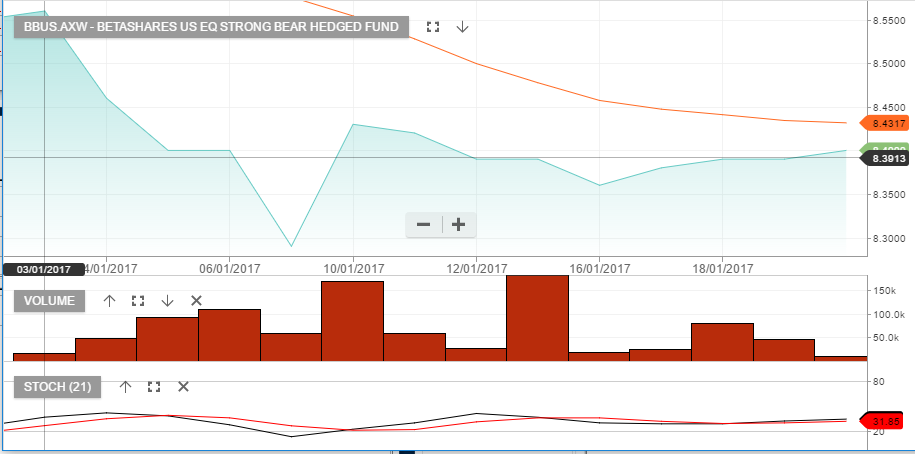
An inverse index ETF is an Exchanged Traded Fund which increases in value when the index trades lower. For portfolio hedging purposes, we use the ASX200 inverse ETF which is listed under the code BEAR. To hedge US stock exposure, we use an inverse ETF based on the S&P500.
Because of our concerns about inflated valuations in certain pockets of the global markets, we feel now is the time to draw our clients attention to these increasingly popular financial products.
Inverse ETFs are way of cost effectively hedging a portfolio and/or profiting from a move lower in Stock indexes
US Earnings Update: AMEX and IBM
Computer giant IBM announced Q4 earnings well above street estimates but lower revenue numbers pressured the stock price lower.
Big Blue reported non-GAAP earnings per share of $5.01 compared to the consensus figure of $4.88. Revenue for Q4 came in at $21.77 billion versus expectations of $21.66 billion. Cloud platform revenue continued to increase which allowed the firm to beat full-year estimates and reach $13.59 in annual earnings per share.
However, despite beating the the Q4 estimates for revenue, overall revenue growth has now dropped for the 19th consecutive quarter. This negative trajectory for overall earnings growth contributed to the sharp intra-day price reversal in IBM shares.
After trading as high as $171.15 after the headline announcement, shares closed lower on the day at $163.50. The next key technical level is found at the December low near $158.00.
American Express reported Q4 earnings which fell short of analysts’ expectations.
The credit card issuer posted adjusted earnings of 91 cents per share on quarterly revenue of $8.02 billion. The street expected earnings of 98 cents per share on revenue of $7.95 billion. In addition, net income fell 8% on a year-on-year basis to $825 million.
AMEX shares have rallied over 20% since hitting the October low of $60.00. We see the business environment improving for for the firm going into 2017. As such, we would expect to see good technical support in the $67.00 area.
Send our ASX Research to your Inbox
Or start a free thirty day trial for our full service, which includes our ASX Research.