MacDonald’s Q4 Results

Despite a solid Q4 earnings report, shares of MacDonald’s Corporation ended the day flat at $121.30.

The fast food giant posted Q4 earnings of $1.44 per share on quarterly revenue of $6.03 billion, which represents a 2.1% increase in earnings and a 10% increase in revenue versus the same period last year.

These Q4 numbers surpassed the expectations of $1.41 per share on revenue of $5.98 billion.

The revenue numbers show a mixed result with company-owned restaurants falling 9% to $3.65 billion, while franchise-operated restaurants grew 3% to $2.38 billion.

Our Algo Engine flagged a short signal in December at $123. We’re watching the price action closely as technically the share price has seen resistance in the $123.00 area.
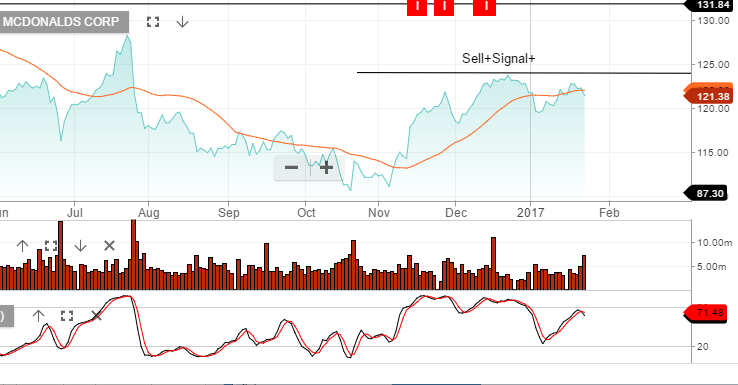
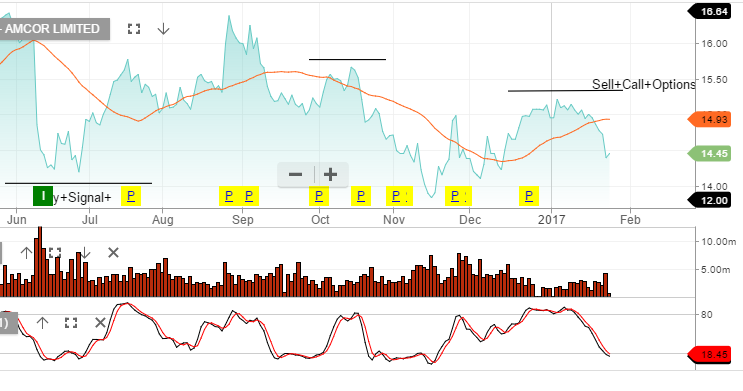
 

Chart – McDonalds Corp

Amcor – Technical update

On February 13th, Amcor will report profits for the July – Dec 2016 period.  We’re looking for the net profit to beat market consensus of $300m.

AMC trades on 17x PE and 4.2% forward yield.

We hold Amcor in our investor model and have been aggressive with selling  the covered call strategy. Whilst we like the defensive qualities of the business, it’s at the top end of our valuation range.

Through adding the covered call option we’re generating 10% cash-flow from the dividend and option premium.

Chart – Amcor


BHP – Production Report

BHP will release its 2Q FY17 production report tomorrow. We anticipate the strength in iron ore, coal and copper will likely see production tracking in-line with FY17 guidance.

The forecast for FY17 revenue of US$40b and net profit of $6.8b should generate an EPS of $1.25, which will  place the stock on a 3.3% forward yield.

We remain long BHP with covered call options at or near $28 into April/May as our preferred strategy.

Chart – BHP


ResMed – Beats Expectations

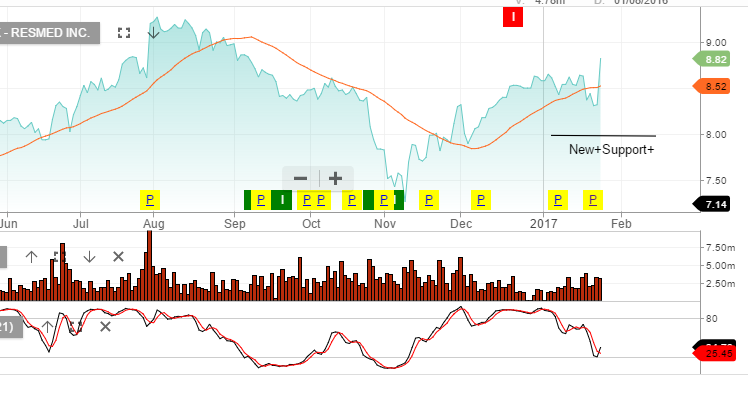
ResMed beat expectations by reporting Q4 earnings of 73 cents per share on quarterly of revenue of $530.40 million. During the same period last year, the firm earned 69 cents per share. This represents a 16.7% increase in revenue from the same period last year.

The street had estimated earnings of 70 cents a share on quarterly revenue of $518.60 million.

These earnings and revenue figures represent a return on equity of 23.10% and a net margin of 17.87%

We started buying ResMed last week, ahead of the earnings release. We’re now up 6% from our entry level and will look at add covered call options to further enhance the return.

Chart – RMD

XJO – Technical Update

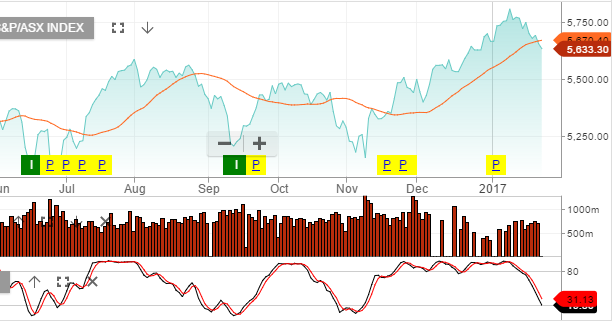
After an 8 year bull market we’re becoming increasingly concerned about equity valuations over the next 3 to 12 month. There are concerning signs in markets and these are starting to show up in the charts.

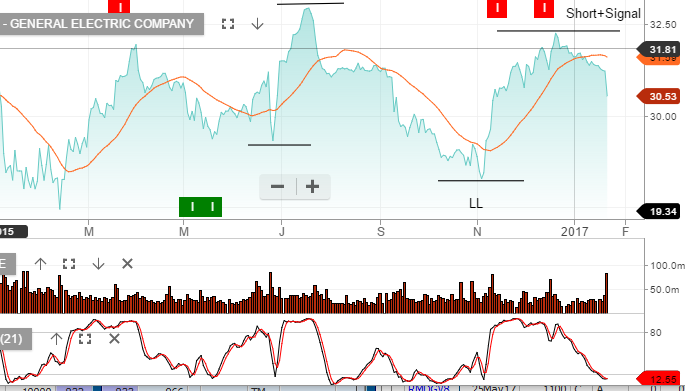
Many large-cap US stocks are showing a “rolling-over” style technical pattern. Following GE’s earnings result last week, along with recent Chinese export data, we’re getting a sense that risks are building.

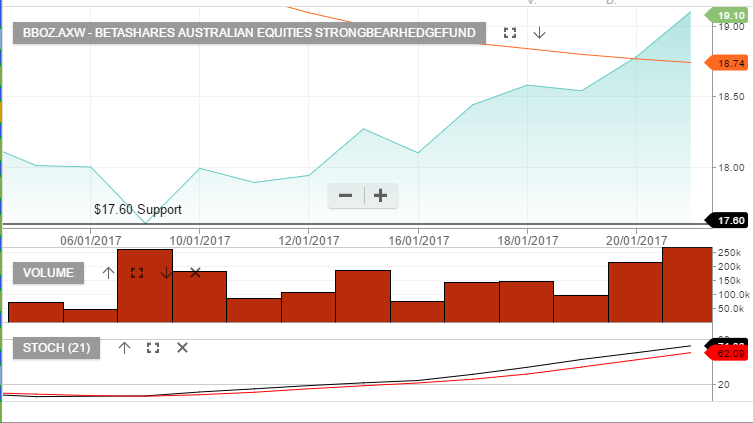
We’ve used the recent rally in banks as an opportunity to take profits and re balance portfolio’s towards defensive names. We’re also adding short exposure through index ETF’s over the XJO and S&P500.

Chart – XJO

Chart – GE


BXB – Algo Short Signal

BXB released a 1H17 trading update which included an FY17 profit warning.

BXB announced that it expects 1H17 constant currency sales and underlying profit growth of only 3%, down from previous forecast of 7 – 10%.

North America Pallets were impacted by both revenue and cost pressures.

We’ve been concerned about BXB’s high PE valuation and low compressed yield. To protect against the risks, we  hedged BXB by approximately 5%, whilst keeping exposure to the upcoming dividend.

At $10.00 we think BXB is a new counter trend buying opportunity and any short exposure or hedging should be closed and new long positions established.

We’ll keep you informed via the blog when this change in directional strategy occurs.

Chart – BXB

S&P 500 Update

The Standard and Poor’s 500 index is a widely followed indicator of the general direction of the US stock market, and by extension, global equity markets.

The reason for the wide following is clear. The S&P 500 comprises 505 common stocks and covers 80% of the American equity market on a capitalization basis.

However, so far this year, the S&P 500 index has had wide intra-day ranges but has gone practically nowhere. It finished the fist week of the year near 2277 and at 2275 in the second. It finished last week near 2274.

The technical indicators are not generating clear signals with the 30-day moving average being tested over the last 4 sessions but not broken.

The prospects of business-friendly policies from the Trump administration may be helping to support the market , while fear that much of the good news has already been discounted in the market has tempered enthusiasm for new buyers.

It’s our view that this indecision pattern will be resolved as the US earnings season moves into its second full week. At this point, the risk remains asymmetrically to the downside on weaker earnings reports, versus the upside potential on better-than-expected reports.