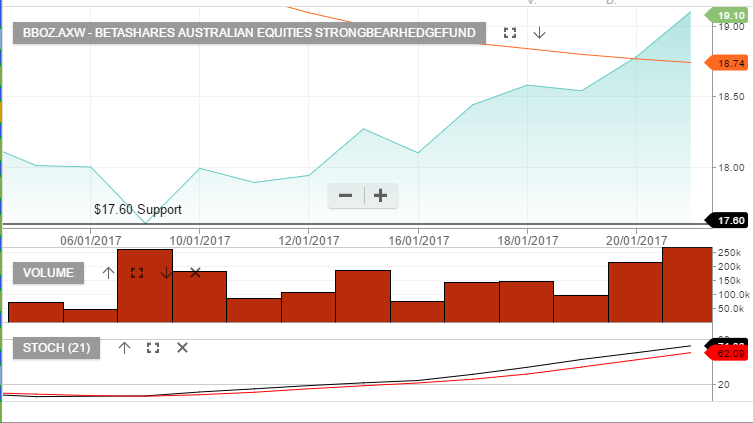
As an update to our ETF Watch segment on the blog, the below chart of the BBOZ ETF, (XJO x2 inverse), reflects the inverse correlation between the XJO and this product. Whilst the XJO has traded lower, the BBOZ ETF has rallied almost 10% since the 9th of January.

Chart – BBOZ ETF (XJO x2 Inverse)