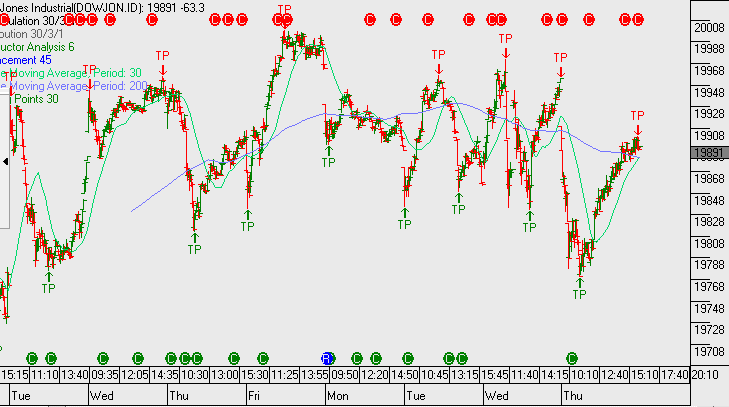
As investors we rarely need to take much notice of intra-day graphs. However, I’ve attached the Dow Jones 5-day graph which shows the price behaviour rolling over, heading into tomorrow’s bank results.
Short-term traders and index investors, (both long and short), will find the chart and strategy outline shown below of interest. As too, would someone running a dynamic portfolio hedge using futures, index options, etc.
The chart pattern shows the recent “lower high and lower low” selling pattern as the index hit resistance just below 20,000. This big number has little relevance to us and is of no real interest. What’s more interesting is the pattern leading into tomorrow’s US bank earnings.
Traders may form a view that staying short the index as long as the price pattern stays below the 19,980 level is warranted.
From an investor perspective, we remain cautious of global markets based on current valuations and increasing macro risks. We continue to position defensively and use covered calls to deliver returns without pursuing an overweight “growth” portfolio allocation.
