James Hardie 1QFY17 Earnings Update

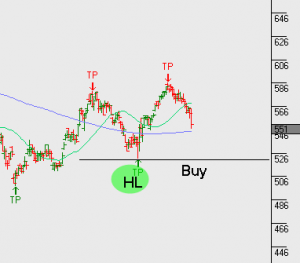
At the end of last week, James Hardie (JHX.ASX) management provided FY17 NPAT guidance for $US260 – $290m which implies growth within our expected target range of 12 – 15%.  These numbers reaffirm our buy on the dip strategy with JHX and  FY17 EBITDA of US$500m, NPAT $275m, dividends per share (DPS) of US$0.45 places the stock on a forward yield of 2.8%.


Global Macro

In the lead up to the UK Referendum on June 23rd, many market commentators warned that a “Brexit” vote would have an acute and immediate impact on domestic UK assets in general, and on the price of the GBP/USD , specifically.   

After posting an intraday low of 1.2800 on July 6th, the Sterling recovered over 5% to reach an intraday high of 1.3481 on July 15th, but only managed to hold on to the 1.3340 level on a closing basis; over 120 points below the high and the highest NY close since.

From a technical perspective, this week’s price action suggests the GBP/USD has completed a bearish pennant formation based on the break of the 1.3220 trend line last week and the failure of the pair to post a NY close above last week’s low close of 1.3020 on August 5th. Following this pattern, the next key support is found at 1.2820 followed by the 1985 low at 1.2750.

An interesting aspect of this this technical pattern is the correlation break and divergence between the Sterling and the FTSE 100 Index. The UK Equities markets rallied alongside the GBP from early July on a combination of “time-lagged” UK economic data and expectations of further stimulus from the Bank of England (BoE).

However, since mid-July, several key UK growth aggregates have softened or offered little in terms of positive forward guidance. As a result, the GBP/USD and the FTSE 100 have diverged with the index posting its highest close of 2016 at 6902.00 today, and the GBP/USD picking up momentum to the downside. It’s reasonable to expect that if this recent trend continues, investors hedging out currency exposure on rising UK equity prices could add to the downside pressure on the Sterling.

Yesterday’s UK Housing Survey illustrates how the Brexit impact may be finally working its way into the overall UK economy. The GBP/USD was triggered lower as the RICS house pricing index slumped to 5% from 15% in June. This was the lowest reading in three years and underscores concerns about how heavily leveraged UK consumers are to housing, and the potential impact on retail spending if the property market continues to adjust lower.
Telstra FY16 Earnings Result

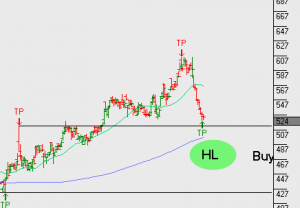
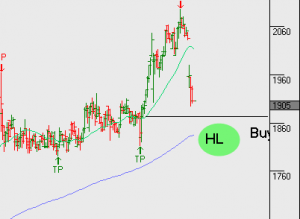
Telstra (TLS.ASX) released its FY16 result with total income up 2.3% to $26.5bn and EBITDA down 3.9% to $10b, final dividend of $0.155 taking the full year dividend to $0.31 FY17 outlook is for 5% income growth and 3 – 5% EBITDA growth.  Capital management of $1.5bn in the form of a share buyback will be welcomed by investors. 

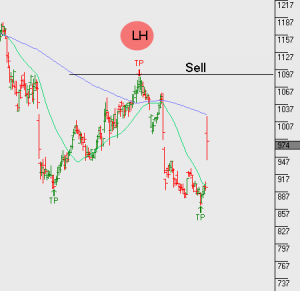
We have been buyers of Telstra since the $5.20 low in June and again on this pullback it’s worth looking for an entry point.   

TLS

Computershare FY 16 Result

CPU.ASX reported FY16 earnings of US$0.55 per share in line with guidance and down almost 8% on the same time last year. The result was impacted by a higher tax rate which masked what looks to be a moderate improvement in the underlying business and this is reflected in managements FY17 guidance of a return to 1 – 3% EPS growth.  

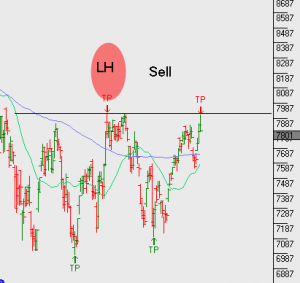
Based FY17 expected earnings it places CPU.ASX on a 3.6% dividend yield and we still have questions around certainty of earnings growth out into FY18 and FY19.

CPU

CBA FY16 Result

CBA.ASX delivered NPAT of $9.45b an increase of 3% on the same time last year. Fully franked final dividend of $2.22 per share.

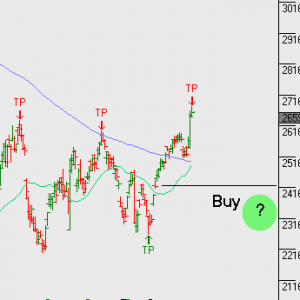
Fy17 EPS growth outlook for 3% placing CBA on an FY17 forward yield of 5.5%.

Best risk reward strategy from here with CBA is to sell European calls at the $75.71 level into Sept for a $2.10 credit, which will keep exposure to the Aug dividend and deliver $4.32 of cash flow from each CBA share, whilst providing some downside protection. For help on this one, please email me  leon@investorsignals.com

CBA


ANZ – 3Q16 earnings

ANZ.ASX ANZ’s 3Q16 update – earnings trends looked a little soft with a pickup in NPAT growth required in 4Q16 to reach consensus forecasts.

Asset quality trends also looked a little disappointing. FY17 forecast EPS growth 2% which places the stock on a forward yield of 6%.

From a technical perspective it’s worth noting the banks have now taken out the most recent highs of the long established down trend that has been in place since May 2015.

The next round of buy signals in the banks will be worth closer consideration.

ANZ


Bendigo and Adelaide Bank 2H16 result

Bendigo (BEN.ASX) 2H16 result confirmed that underlying operating conditions remain challenging. Revenue grew by 2% compared to the 1H16 and the outlook remains challenging with subdued volume loan growth and ongoing pressure on margins from competition and lower interest rates.  

FY17 outlook is for cash earnings of around $450m on EPS of $0.96 and dividend payout of $0.67 placing the stock on a forward yield of almost 6.8%.

No signal present.